
SLIDE 1
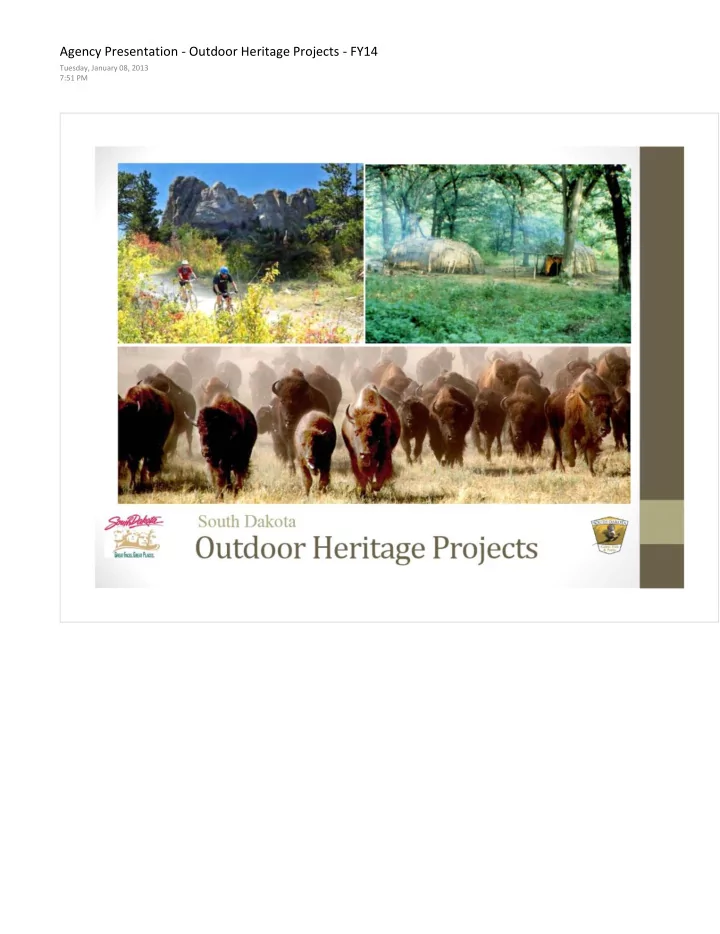
Agency Presentation - Outdoor Heritage Projects - FY14
Tuesday, January 08, 2013 7:51 PM
Sot th Dakota
Outdoor Heritage Projects Blood Run Blood Run Oak Forest Blood Run - - PDF document
Agency Presentation - Outdoor Heritage Projects - FY14 Tuesday, January 08, 2013 7:51 PM Sot th Dakota Outdoor Heritage Projects Blood Run Blood Run Oak Forest Blood Run 2012 Big Sioux River overlook Blood Run - National Historic Landmark
Agency Presentation - Outdoor Heritage Projects - FY14
Tuesday, January 08, 2013 7:51 PM
Sot th Dakota
Blood Run
Blood Run 2012
Big Sioux River overlook
Blood Run - National Historic Landmark
(~out aKota & owa)
Blood Run National Historic Landmark
7
Blood Run Master Plan
facilitate alternate access
connect properties
facilities
Blood Run
Visitor Center Concept
Blood Run 2012
School Group
Blood Run Phase I Development & Visitor Center
General Fund Game, Fish and Parks Parks and Wildlife Foundation Subtotal $2.0 M $1.0 M $2.0 M $5.0 M
Custer State Park
Existing Visitor Center
C 1ster State Par
Need: Visitor Center w /Theatre
Option 1
Option 2
Custer State Park
Custer State Park
General Fund Game, Fish and Parks Parks and Wildlife Foundation Subtotal $1.5 M $0.5 M
$1.0 M
$3.0 M
Mount Rushmore National Memorial
Mickelson Trail-Mt Rushmore Connector
Mount Rushmore Connector Trail
Feasibility Study
George S. Mickelson Trail to Mt. Rushmore National Memorial Connector Trail Feasibility Study
Mount Rushmore - Mickelson Trail
8-mi e Connector Trail
Hill City
Bea G
Id!
Trailhead
Route Consideration 2
Moun"t
Rushmore
BlackBeny ra· lro Cree Hooe camp I'
0;_,,o
a m _
v _ _.
..
V1
11George S. Mickelson Trail to Mt. Rushmore National Memorial Connector Trail
Mount Rushmore - Mickelson Trail
Mu ti-use Connector Trail
Mickelson Trail to Mount Rushmore
EIS and "Seed" Money
General Fund
Mount Rushmore Society
GFP (Recreational Trail Fund)
Parks and Wildlife Foundation Subtotal $0.5 M $1.0 M $0.4 M $0.1 M $2.0 M
Summary
General Fund Parks and Wildlife Foundation Game, Fish and Parks
Mount Rushmore NM Society
$4.0 M $3.1 M $1.9 M $1.0 M TOTAL $10.0 M
SD State Parks System
2011 Flood
Fall 2011
July 2012
Summer2011
Fall 2011
Summer2012
Summer2011
Summer2011
August2011
20 2
State Park System
2011 Flood Recovery Projected Costs
$3.9 million spent to date $2.9 million additional complete in FY 13
$0.6 million budgeted in FY 14
$7.4 million total flood recovery effort
Division of Parks & Recreation
Park Visitation and Revenue 2012
Fisheries
Oahe Forage fish
releases - primary forage fish
Fisheries
Lake Oahe Walleye Regulations
for harvest:
inches)
Fisheries
2012 Fishing License Sales
Up 18% over 2011
Up 36% over 2011
South Dakota State Park System
Calendar year 2012 Visitation
Average gas price
2005 - $2.28 2006 - $2.57 2007 - $2.84 2008-$3.24 2009 - $2.37 2010 - $2.80 2011- $3.55 2012 - $3.64
8,000,000 -!--------------------- 7,000,000 6,000,000 5,000,000 4,000,000 3,000,000 2,000,000 1,000,000 2005 2006 2007 2008 2009 2010 2011 2012
Recreation Area Totals
South Dakota State Park System
Camping units
275,000 250,000 225,000 200,000 175,000 150,000
N N N N N N N N N N N
~ ~ ~
N W
~ ~
m
~
00
~ ~
N
Camping at all SD State Parks
Calendar year 2012
Non- Resident 84,623 31% Resident 185,793 69%
Total: 270,416
Camping at SD State Parks
Ca endarYear 2012
Custer State Park
Non- Resident
32,781 74%
Resident
11,584 26%
Total: 44,365
lewis & Clark Recreation Area
Non- Resident
15,882
Resident
21,742 58%
Total: 37,624
All other parks
Non- Resident
35,960 19%
Resident
152,467 81%
Total: 188,427
The Economic Impact of
the
SD Snowmobile Industry
011th Ualwta s nowmot)lfe trmt J tem 1
r: 1 1med 1i ithout any con1nbution from
general fund dollars, but brin~ ubstantial economic ac11vity 10 the tale
Cr..
IVFRSITY OF
'i!J SOUTH DAKOTA
Study prepared by: Michael Allgrun, Ph.D. Beacom School of Business University of South Dakota
~ STATE
PARKS
D1111a11me111 ol Gi11118. fish and P ks The Economic Impact of the
SD Snowmobile Industry
The snowmobiling industry generates approximately $131.6 million in annual economic impact to South Dakota.
retailers and distributors.
and other trip-related spending.
the Black Hills more highly than alternative destinations.
Crl U
I
FRSITY OF
'i!J SOUTH DAKOTA
Prepared by: Michael Allgrun, Ph.D. Beacom School of Business University of South Dakota
~ STATE
PARKS
Deua111 nl ol Game, Fish nd Parks Department of Game, Fish and Parks
Division of Parks & Recreation
Ca endar ear 20 2 evenue
$8,000,000 $6,000,000 $4,000,000 $2,000,000 $0 2008 2009 2010
Camping Revenue
2011
Park Revenue
2012
Division of Parks & Recreation
10 Year General Fund Budget History
$4,000,000 $3,500,000 $3,000,000 $2,500,000 $2,000,000 $1,500,000 $1,000,000 $500,000 $0
"TI
N V,
"TI "TI
N N 0)
Operations
=!2
"TI "TI "TI "TI
N N N N N
1--' 1--' 1--'
00 I.D
1--'
N
Bond Payments
"TI
:!2
N N
1--' 1--'
w
.i:,.