
SLIDE 1
9/26/2014 1
CEE 697z
Organic Compounds in Water and Wastewater
NOM Characterization II
Print version
Dave Reckhow - Organics In W & WW
Lecture #8
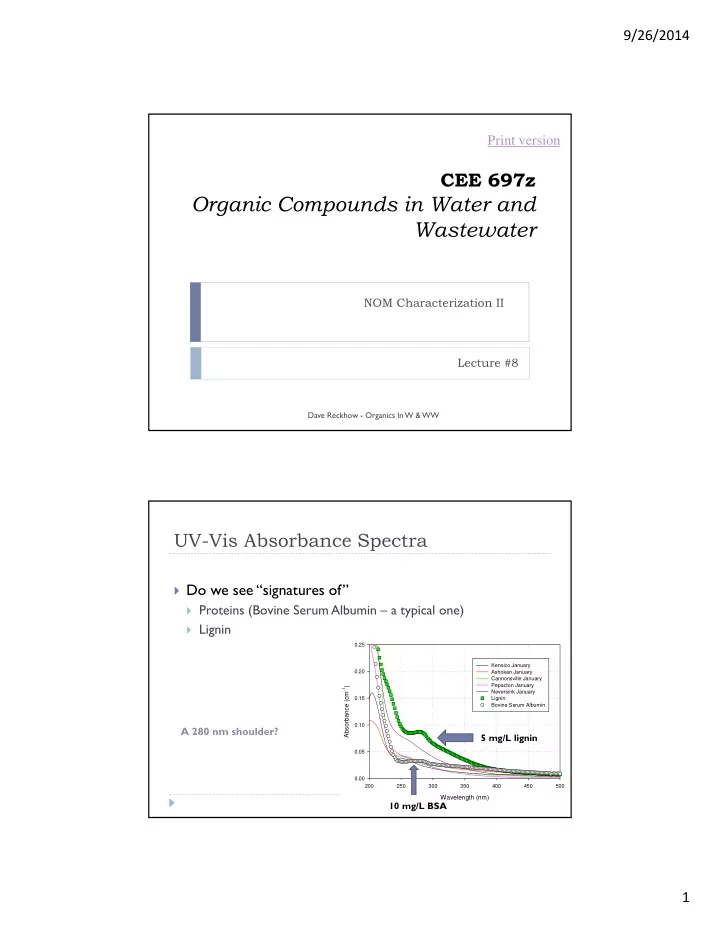
UV-Vis Absorbance Spectra
Do we see “signatures of”
Proteins (Bovine Serum Albumin – a typical one) Lignin
Wavelength (nm)
200 250 300 350 400 450 500
Absorbance (cm-1)
0.00 0.05 0.10 0.15 0.20 0.25 Kensico January Ashokan January Cannonsville January Pepacton January Neversink January Lignin Bovine Serum Albumin
5 mg/L lignin 10 mg/L BSA