
SLIDE 1
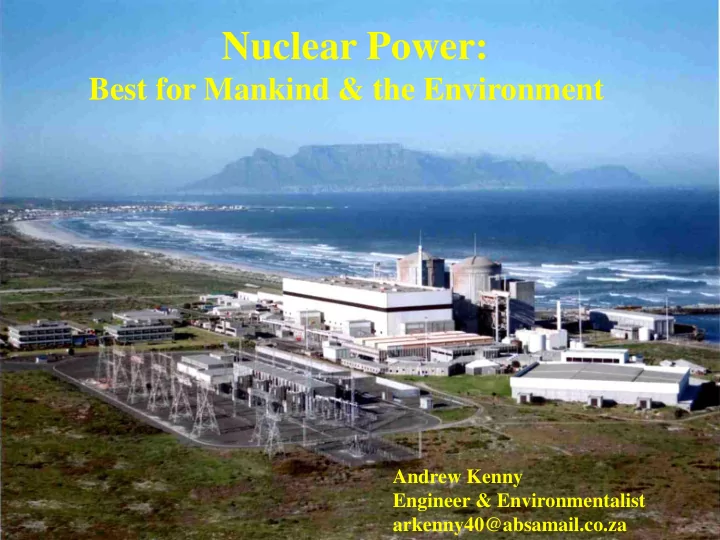
Nuclear Power:
Best for Mankind & the Environment
Andrew Kenny Engineer & Environmentalist arkenny40@absamail.co.za
Nuclear Power: Best for Mankind & the Environment Andrew Kenny - - PowerPoint PPT Presentation
Nuclear Power: Best for Mankind & the Environment Andrew Kenny Engineer & Environmentalist arkenny40@absamail.co.za Personal Note My qualifications: I must confess I have few qualifications on this subject, except for degrees
Andrew Kenny Engineer & Environmentalist arkenny40@absamail.co.za
– I must confess I have few qualifications on this subject, except for degrees in maths, physics and engineering, registration as a professional engineer, and about 25 years experience in industry and energy research.
– I work for myself. Last year I received a total of R6,740 for work in nuclear (talks and articles). This year, so far, the only material benefit I shall receive from nuclear is a free lunch from the Catholic Conference today.
– I believe profoundly in liberty and protecting the planet.
– I am a fallen Catholic. I regard Jesus as the supreme moral leader. I agree entirely with the Sermon on the Mount. I greatly admire and respect the Catholic Church. But I just do not believe in the supernatural world
Koeberg Nature Reserve.
Solar water heating, wind pumps on Karoo farms, small electricity generation
150000 160000 170000 180000 190000 200000 210000 220000 230000 240000 250000
GWh
Source: StatsSA
meet our demand.
– Economic growth has been stifled – Industrial projects have been cancelled – Investment has been deterred. – Manufacturing is in decline. – We export raw materials instead of adding value. – Poverty has increased. – Unemployment has increased.
to: – Allow for even a low growth of 3% – Replace old power stations
10 000 15 000 20 000 25 000 30 000 35 000 40 000
MW Eskom Generation Capacity by Energy Source. 2014 Source: Eskom Fact Sheet.
Operating In Construction Operating In Construction
–
north east of SA –
–
–
technology
– By far the best safety record of any source of energy (over full energy chain).
– Smallest environmental disruption – Most efficient use of natural resources – Least waste problem
– Always competitive, often the cheapest source of electricity (France, US, Germany, Japan etc)
– The most reliable source of electricity.
– Enough uranium & thorium in the ground & sea to provide nuclear electricity for the life of the planet.
– Can be sited wherever you want. On coasts for sea water cooling. Near centres of demand. Allows distributive generation
1119 397 135 105 11 1
200 400 600 800 1000 1200
Coal Oil Natural gas LPG Hydropower Nuclear Number of Accidents with at least 5 Deaths in Full Energy Chain 1969 to 2000
Comparing Nuclear Accident Risks with Those from Other Energy Sources. OECD 2010. ISBN 978-92-64-99122-4
– Instrument failures and operator error lead to the partial meltdown of the reactor. – Deaths from the radiation: 0
– The fundamental cause was bad reactor design. The contributing cause was deliberate violation of safe operating procedures. – Deaths from the radiation: 50 to 60 (Chernobyl Forum 2005)
– A monstrous earthquake and tsunami damaged four old nuclear reactors and removed their power supply. – Deaths from the radiation: 0
people in the same period, usually without any comment from the same people who shout about nuclear accidents.
cheapest source of power.
expensive electricity in Europe.
– the more nuclear power a country has, the cheaper its electricity – the more renewable energy it has, the more expensive its electricity.
maintenance), and capital.
–
–
–
designs.
0,00 5,00 10,00 15,00 20,00 25,00
Source: Ventyx Velocity Suite
Vendor Buyer Reactor No of units Capacity Cost Unit cost MW $ $/kW Korea UAE APR1000 4 5400 2.04E+10 3778 Russia Turkey VVER1200 4 4800 1.90E+10 3958 Russia Belarus VVER1200 2 2400 1.00E+10 4167 China Pakistan ACP1000 2 2200 9.60E+09 4364 Russia India VVER1000 2 2000 5.78E+09 2890
435 reactors operating. 71 under construction. About 11% of world’s electricity. Some recent nuclear power deals: Some construction times in years, 2004 to 2014: The only new nuclear construction badly late is the French EPR in Finland and Flamanville.
way (physics & observation). – In the last half billion years, CO2 has averaged above 2000 ppm; it is now 400 ppm – The slight warming of the 20th Century was no different from previous natural warming periods – There has been NO WARMING in the last 18 years while CO2 has risen considerably
and forests, greening the arid regions of the world, such as the Sahel
renewables DO NOT.
– “The energy-related emissions are estimated to increase in Germany by about 20 million tons”, said Hans-Joachim Ziesing, managing director of the Working Group on Energy Balances, a statistical agency.
– Water heating, water pumps, small scale electricity supply etc
electricity.
– wind in Germany: 17% – Nuclear in Germany: 90% – To produce the same amount of electricity as Koeberg would require over 3,500 wind turbines, each 90 metres high (2 MW)
the electricity supply system.
– Has meaning for coal, oil, gas, nuclear & hydro electricity – Is meaningless for solar and wind.
no value.
a high price for wind electricity whether it is wanted or not. The grid then passes the costs on the
– A torch that only works 20% of the time and you never know when? – Brakes for your car that only work 20% of the time and you never know when?
Blacklaw Windfarm, Scotland
Built on an inhuman scale
2. Massive, wasteful, inefficient use of the Earth’s resources 10x as much concrete & steel per kWh as nuclear 3. Extremely Expensive Completely dependent on subsidies enforced by government.
Hopelessly Unreliable, Pitifully Low Capacity Factors
Suffering to Local People & Little People Drop in property values. Illness from Wind Turbine Syndrome
5000 10000 15000 20000 25000 30000 35000 40000 45000 MW 7 to 21 May 2015
UK electricity demand: 7 to 21 May 2015
Capacity (MW): Wind: 12,440 Nuclear: 9,234 Source: UK Power Generation Info
to phase out nuclear power, her safest & cheapest source of electricity, and replace it with wind & solar.
– 800,000 Germans cannot pay their electricity bills (Die Welt. 26 June 2012) – Industries shutting down or relocating (to the US for example)
– Huge increase in power failures, grid fluctuations, stoppages, damage
– The rich developers make money from the enormous subsidies to wind & solar, the only reason anyone invests in wind & solar for grid electricity – This represents a transfer of money from the poor to the rich
– Nuclear power is power for the people. – Solar and wind are power for the rich elite.
Capacity Production Average Production Load Factor % of total Production MW TWh MW % % Wind 32,500 47.2 5,400 16.6 8.4 Solar 35,700 29.7 3,400 9.5 5.3 Wind + solar 68,200 76.9 8,800 12.9 12.9 Nuclear 12,100 92.3 10,500 87.3 16.5 (SA total) (42,000) (233.1) (26,600) (63.4)
Germany has spent vast amounts of money on thousands of gigantic wind turbines and huge arrays of photovoltaic panels. Here are the results for 2013.
Source: FRAUNHOFER INSTITUTE FOR SOLAR ENERGY SYSTEMS ISE
Programme) invites private companies to tender for renewable electricity supply. Eskom is forced to buy their electricity.
– Obviously solar and wind can never compete in a free market for grid electricity.
to pay a high price for it whether it is needed or not. Eskom then passes on the costs to consumers. This is one reason why Eskom is asking for a price increase for its electricity.
– We are not allowed to know the production of the Darling Wind Farm, which began in 2008 – We are not allowed to know the production of wind farms under the REIPPPP.
wind and solar anywhere else in the world (no doubt making fat profits for the rich developers).
Eastern Province.
Town, and look at it. – Koeberg is the most successful power station in SA history. It is the only reliable big station in SA. It is the most reliable station in SA, producing electricity at the lowest estimated costs. It has greatly improved the local environment.
– Threatened birds of prey slaughtered by wind turbines – A study by the California Energy Commission on the Altamont Pass wind farm found that it killed every year about 4,700 birds from 40 different species, including 1,300 protected raptors. (eagles and others)
White Tailed Sea Eagle killed by wind turbine, Norway Two griffon vultures killed by turbines in Navarre, Spain. One of them has been sliced in half by the blade.
Short-toed Eagle killed by wind turbine, Spain Paul, My cat
Birds at Koeberg Nature Reserve
Black Oystercatcher Cormorants Southern Red Bishop African Spoonbills
Reference for Concrete and Steel for Nuclear and Wind Metal And Concrete Inputs For Several Nuclear Power Plants. Per F. Peterson, Haihua Zhao, and Robert Petroski. University
94720-1730. peterson@nuc.berkeley.edu. Report UCBTH- 05-001. February 4, 2005
50 100 150 200 250 300
mSv mSv/y
Radiation: Fukushima accident compared with natural levels
France gets 75%+ of electricity from nuclear. Germany is phasing nuclear out.
Source: OECD adjusted for French and German inflation
nuclear power plant type gross capacity MWe net capacity MWe gross electricity generation 2012 MWh in operation GKN-2 Neckar PWR 1,400 1,310 11,126,700 KBR Brokdorf PWR 1,480 1,410 10,768,134 KKE Emsland PWR 1,400 1,329 11,430,762 KKG Grafenrheinfeld PWR 1,345 1,275 10,601,671 KKI-2 Isar PWR 1,485 1,410 12,082,399 KKP-2 Philippsburg PWR 1,468 1,402 10,778,670 KRB B Gundremmingen BWR 1,344 1,284 10,366,208 KRB C Gundremmingen BWR 1,344 1,288 10,613,396 KWG Grohnde PWR 1,430 1,360 11,692,258 subtotal 1 12,696 12,068 99,460,198
European Nuclear Society
52,11 1,13
10 20 30 40 50 60
Wind Nuclear
Deaths/ PWh
Deaths / PWh for Wind & Nuclear from their Inception to 2011
Nuclear: Benjamin K. Sovacool. A Critical Evaluation of Nuclear Power and Renewable Electricity in Asia Journal of Contemporary Asia, Vol. 40, No. 3, August 2010. Wind: Caithness Windfarm
December 11th, 2011 www.sauvonsleclimat.org 39
Wind Production in 7 countries of West Europe from September 2010 to March 2011 Intermittency effects remain big
0,00 10000,00 20000,00 30000,00 40000,00 50000,00 60000,00 Sep 1 Sep 5 Sep 9 Sep 13 Sep 17 Sep 21 Sep 25 Sep 29 Oct 3 Oct 7 Oct 11 Oct 15 Oct 19 Oct 23 Oct 27 Oct 31 Nov 4 Nov 8 Nov 12 Nov 16 Nov 20 Nov 24 Nov 28 Dec 2 Dec 6 Dec 10 Dec 14 Dec 18 Dec 22 Dec 26 Dec 30 Jan 3 Jan 7 Jan 11 Jan 15 Jan 19 Jan 23 Jan 27 Jan 31 Feb 4 Feb 8 Feb 12 Feb 16 Feb 20 Feb 24 Feb 28 Mar 4 Mar 8 Mar 12 Mar 16 Mar 20 Mar 24 Mar 28
Allemagne plus Autriche France Espagne Danemark Irlande UK
This figure presents the cumulative power generated in these 7 countries. Since Germany and Spain alone represent 75% of total power it does not give a sufficiently clear long term view of European wind production variations
100 200 300 400 500 600 700 800 900 1000
Nuclear Wind
M3/ Av MW
Steel & Concrete Requirements for Nuclear & Wind Plants
Metal And Concrete Inputs For Several Nuclear Power Plants Per F. Peterson, Haihua Zhao, and Robert Petroski University of California, Berkeley, 4153 Etcheverry Berkeley, California 94720-1730 peterso
Steel Concrete
Official studies carried out five years ago in Dalahai village in China confirmed there were unusually high rates of cancer along with high rates of osteoporosis and skin and respiratory diseases. (SIMON PARRY in China and ED DOUGLAS in Scotland. Daily Mail.
26 Jan 2011.)
Toxic chemical wastes are causing illness, diseases, infant abnormalities in communities near these mines. Fish are dying in the rivers. In China, there are filthy mines for neodymium, a rare earth used in the generators
One of the radioactive wastes is thorium but because of its very long half-life this is not much of a problem
.
Note: neodymium can and should be mined cleanly. The lake of toxic waste at Baotou, China. Mining for neodymium, used in wind generators
J F van de Vate. Elsevier. Energy Policy. Vol 25 No1 1997
100 200 300 400 500 600 700 gCeq / kWh Nuclear Wind Biomass Hydro Solar PV Nat gas Oil Coal Lignite