
SLIDE 1
copyrig ight 2010, Sh Shell ll Explo loratio ion and Pr Productio ion Co., and it its affi filia liates
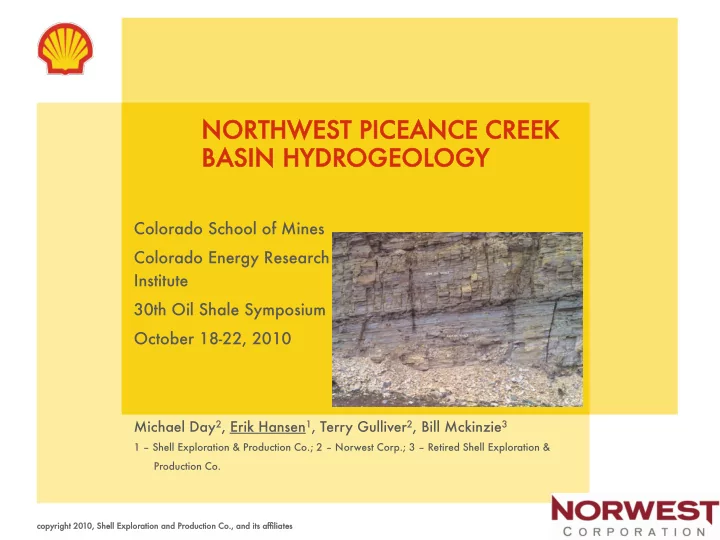
NORTHWEST ST PI PICEANCE CREEK BASI SIN HYDROGEOLOGY
Colorado School of Mines Colorado Energy Research Institute 30th Oil Shale Symposium October 18-22, 2010
Michael Day2, Erik Hansen1, Terry Gulliver2, Bill Mckinzie3
1 – Shell Exploration & Production Co.; 2 – Norwest Corp.; 3 – Retired Shell Exploration & Production Co.