
SLIDE 1
t r i g o n o m e t r i c f u n c t i o n s
MCR3U: Functions
Graphs of Sine, Cosine and Tangent Functions
- J. Garvin
Slide 1/20
t r i g o n o m e t r i c f u n c t i o n s
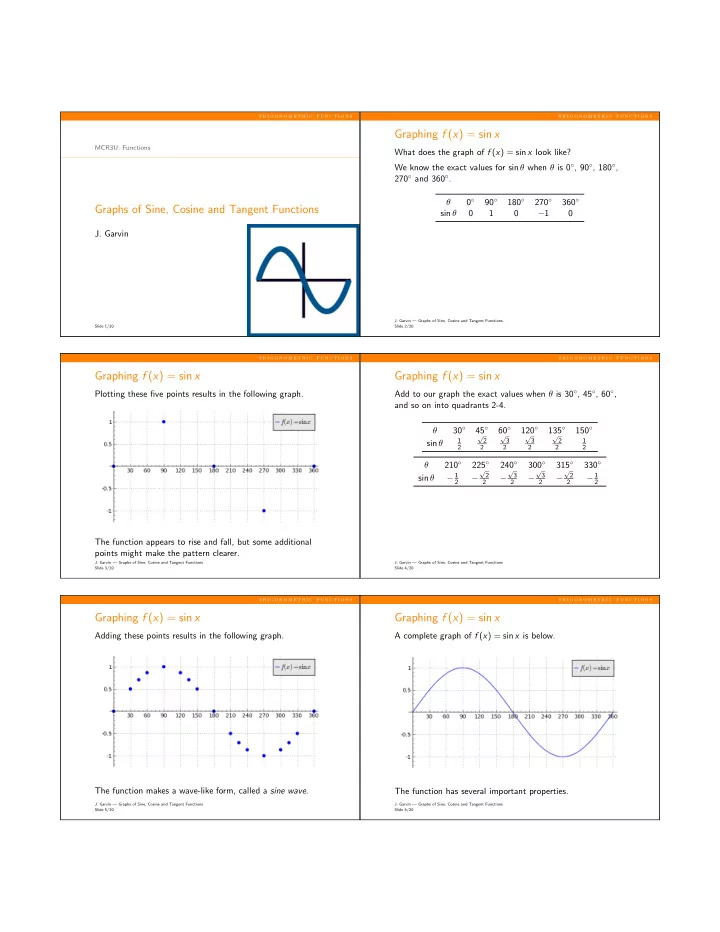
Graphing f (x) = sin x
What does the graph of f (x) = sin x look like? We know the exact values for sin θ when θ is 0◦, 90◦, 180◦, 270◦ and 360◦. θ 0◦ 90◦ 180◦ 270◦ 360◦ sin θ 1 −1
- J. Garvin — Graphs of Sine, Cosine and Tangent Functions
Slide 2/20
t r i g o n o m e t r i c f u n c t i o n s
Graphing f (x) = sin x
Plotting these five points results in the following graph. The function appears to rise and fall, but some additional points might make the pattern clearer.
- J. Garvin — Graphs of Sine, Cosine and Tangent Functions
Slide 3/20
t r i g o n o m e t r i c f u n c t i o n s
Graphing f (x) = sin x
Add to our graph the exact values when θ is 30◦, 45◦, 60◦, and so on into quadrants 2-4. θ 30◦ 45◦ 60◦ 120◦ 135◦ 150◦ sin θ
1 2 √ 2 2 √ 3 2 √ 3 2 √ 2 2 1 2
θ 210◦ 225◦ 240◦ 300◦ 315◦ 330◦ sin θ − 1
2
−
√ 2 2
−
√ 3 2
−
√ 3 2
−
√ 2 2
− 1
2
- J. Garvin — Graphs of Sine, Cosine and Tangent Functions
Slide 4/20
t r i g o n o m e t r i c f u n c t i o n s
Graphing f (x) = sin x
Adding these points results in the following graph. The function makes a wave-like form, called a sine wave.
- J. Garvin — Graphs of Sine, Cosine and Tangent Functions
Slide 5/20
t r i g o n o m e t r i c f u n c t i o n s
Graphing f (x) = sin x
A complete graph of f (x) = sin x is below. The function has several important properties.
- J. Garvin — Graphs of Sine, Cosine and Tangent Functions
Slide 6/20