
SLIDE 1
www.lcra.org
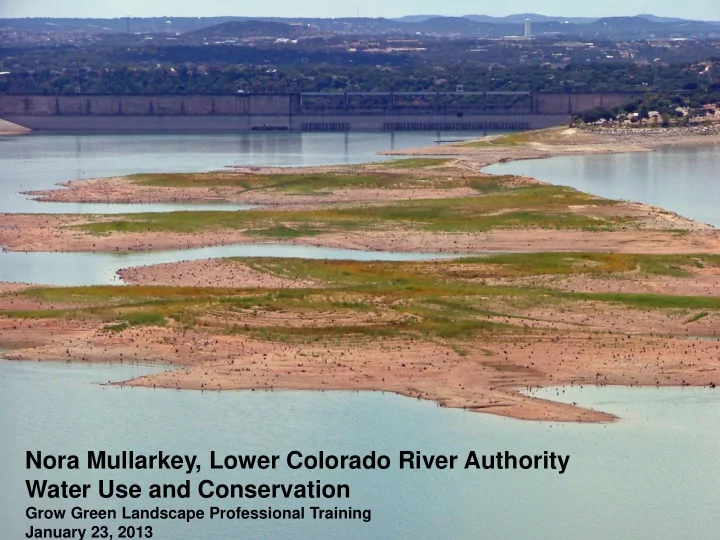
Nora Mullarkey, Lower Colorado River Authority Water Use and Conservation
Grow Green Landscape Professional Training January 23, 2013
Nora Mullarkey, Lower Colorado River Authority Water Use and - - PowerPoint PPT Presentation
www.lcra.org Nora Mullarkey, Lower Colorado River Authority Water Use and Conservation Grow Green Landscape Professional Training January 23, 2013 Water Use and Conservation www.lcra.org Summary of State and Regional Water Plans How
www.lcra.org
Grow Green Landscape Professional Training January 23, 2013
www.lcra.org
www.lcra.org
Source: Texas Water Development Board. Water for Texas. 2012 State Water Plan.
www.lcra.org
Source: Texas Water Development Board. Water for Texas. 2012 State Water Plan.
www.lcra.org
Source: Texas Water Development Board. Water for Texas. 2012 State Water Plan.
www.lcra.org
Source: Texas Water Development Board. Water for Texas. 2012 State Water Plan.
www.lcra.org
7
Source: Texas Water Development Board. Water for Texas. 2012 State Water Plan.
www.lcra.org
Source: Texas Water Development Board. Water For Texas: Summary
www.lcra.org
Source: Texas Water Development Board. Water For Texas: Summary of the 2011 Regional Water Plans.
www.lcra.org
Source: Fishman, Charles. The Big Thirst. The Secret Life and Turbulent Future of Water.
www.lcra.org
www.lcra.org
12
www.lcra.org
www.lcra.org
* Study can be found at www.aquacraft.com
www.lcra.org
www.lcra.org
Return to U.S. Drought Monitor Return to Region The data cutoff for Drought Monitor maps is Tuesday at 7 a.m. Eastern Time. The maps, which are based on analysis of the data, are released each Thursday at 8:30 a.m. Eastern Time.
www.lcra.org
www.lcra.org
www.lcra.org
Pressure (PSI) Water Loss Multiplier
19
www.lcra.org
20
www.lcra.org
* Title 30, Texas Administrative Code. Chapter 344 Landscape Irrigation.
www.lcra.org
* Title 30, Texas Administrative Code.
Chapter 344 Landscape Irrigation.
www.lcra.org
23