
SLIDE 1
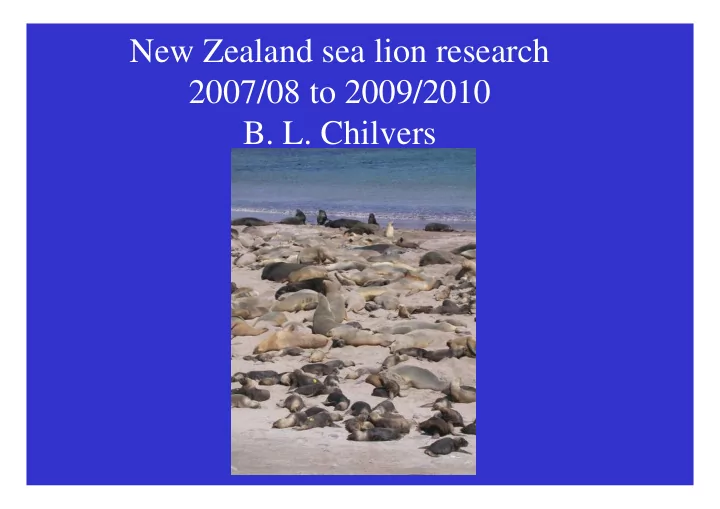
New Zealand sea lion research 2007/08 to 2009/2010
- B. L. Chilvers
New Zealand sea lion research 2007/08 to 2009/2010 B. L. Chilvers - - PowerPoint PPT Presentation
New Zealand sea lion research 2007/08 to 2009/2010 B. L. Chilvers NZ sea lion research objectives Auckland Islands Measure Auckland Islands pup production Tag pups produced each year Collect data to estimate survival and
4 1 5 7 48 55 151 1218 1369 21 364 385 09/10 6 8 14 6 48 54 67 1065 1132 12 289 301 08/09 5 13 18 2 72 74 123 1512 1635 23 425 448 07/08
5 19 24 3 67 70 106 1587 1693 23 414 437 06/07 4 20 24 7 55 62 232 1349 1581 39 383 422 05/06 6 31 37 4 79 83 74 1513 1587 30 411 441 04/05 13 39 52 1 86 87 120 1749 1869 34 473 507 03/04 17 26 43 5 89 95 336 1555 1891 80 408 489 02/03 6 21 27 6 90 96 361 1395 1756 83 320 403 01/02 8 47 55 2 92 94 346 1802 2148 35 527 562 00/01 13 37 50 6 131 137 124 2039 2163 24 482 506 99/00 17 42 59 9 100 109 229 1957 2186 40 473 513 98/99 dead alive total dead alive total dead alive total dead alive total
South East Point Figure of Eight Island Dundas Island Sandy Bay Season
1200 1400 1600 1800 2000 2200 2400 2600 2800 3000 1 9 9 8 / 9 9 1 9 9 9 / 2 / 1 2 1 / 2 2 2 / 3 2 3 / 4 2 4 / 5 2 5 / 6 2 6 / 7 2 7 / 8 2 8 / 9 2 9 / 1 Year Total Pup Production
Sandy Bay
100 200 300 400 500 600 1999 2000 2001 2002 2003 2004 2005 2006 2007 2008 2009 2010 Year Total pup production
Dundas Island
1000 1100 1200 1300 1400 1500 1600 1700 1800 1900 2000 2100 2200 2300 1999 2000 2001 2002 2003 2004 2005 2006 2007 2008 2009 2010 Breeding season Number of Pups
Figure of Eight
10 20 30 40 50 60 70 80 90 100 110 120 130 140 150 1999 2000 2001 2002 2003 2004 2005 2006 2007 2008 2009 2010 Breeding season Number of pups
South East point
10 20 30 40 50 60 70 1999 2000 2001 2002 2003 2004 2005 2006 2007 2008 2009 2010 Breeding season Number of pups
5 10 15 20 25 1998 1999 2000 2001 2002 2003 2004 2005 2006 2007 2008 2009 2010 Year % Mortality
5 10 15 20 25 30 35 40 45 97/98 98/99 99/00 00/01 01/02 02/03 03/04 04/05 05/06 06/07 07/08 08/09 09/10
Year Percentage pup mortality
Pup mortality 1 month Pup mortality 2 months
Dates, tag number, satellite tag id, sex, age, weight, length, girth, number of days deployed and number of satellite locations received from juvenile sea lions captured
1157 71 91 156 77.5 2 M 49094 8179 30/01/2010 247 12 111 157 89 3 M 76964 7260 28/01/2010 569 31 125 209 150 5 M 54760 5752 28/01/2010 143 7 100 152 68 3 F 76965 7584 24/01/2010 222 16 98 153 73 3 F 98814 7458 15/01/2010 209 16 107 154 78.5 3 F 76963 7199 15/01/2010 206 17 84 135 54 2 F 49094 8023 25/01/2009 149 9 83 138 53 2 F 89574 7445 25/01/2009 235 19 93 157 70 3 F 76963 6536 20/01/2009 570 38 92 155 76 3 M 54761 6218 20/01/2009 139 13 104 160 81 3 M 54760 6214 20/01/2009 316 25 84 140 54 2 F 76965 7610 19/01/2009 208 12 98 159 85 3 M 67260 6485 19/01/2009 135 10 98 165 79 3 F 76964 6363 15/01/2009 105 13 90 140 57 2 F 49093 7458 15/01/2009 138 14 107 184 117 5 M 1757 4907 11/01/2009 39 4 96 154 84.5 3 F 54759 6059 26/01/2008 217 11 95 156 68 3 F 54761 5913 25/01/2008 322 31 91 146 73.5 2 F 67259 6463 25/01/2008 26 2 89 152 68 3 F 54756 5863 24/01/2008 183 14 92 141 71 3 F 76966 5857 18/01/2008 248 17 87 153 68 3 F 76964 6130 17/01/2008 309 16 106 177 102 5 M 54760 3727 14/01/2008 7 2 100 164 83 4 M 54757 5093 14/01/2008 366 49 126 184 134.5 4 M 49095 5051 14/01/2008 215 14 108 180 103.5 5 M 49094 4121 14/01/2008 Number of satellite locations Days Girth (cm) Length (cm) Weight (kg) Age Sex Satellite tag id Tag Date
2008 2009 2010 Estimated distribution of juvenile NZ sea lions (satellite locations/10 x 10 km area January & February)
Low Med High Tow start positions /10km2
Low Med High Tow start positions /10km2
2008a 2009a 2010a 2008b 2009b 2010b
a) The distribution of fishing effort in the 6T squid trawl fishery (tow start positions/10 x 10 km area, February to June ot close of fishery 2008-2010) in the Auckland Islands 6T area (Scale 1-10 locations or tows per area (Low), 11- 20, 21-30 (Med), 31-40, 40+ (High)). b) The estimated interaction probability between juvenile NZ sea lion distribution and fishing activities for each year are presented in 3b (Scale 1 (Low), 2, 3-4 (Med), 5-6, 7 (High)).
Low Med High Interaction probability
2008a 2009a 2008b 2009b 2010a 2010b
a) The spatial distribution of scampi fisheries (October to June each season) and b) all other tows recorded in other fisheries for each season 2008, 2009, 2010 in the Auckland Islands 6T area (Scale 1-10 locations or tows per area (Low), 11- 20, 21-30 (Med), 31-40, 40+ (High)). Circles indicate the only areas where overlap with juvenile NZ sea lion satellite locations occur.
Low Med High Tow start positions /10km2