SLIDE 1
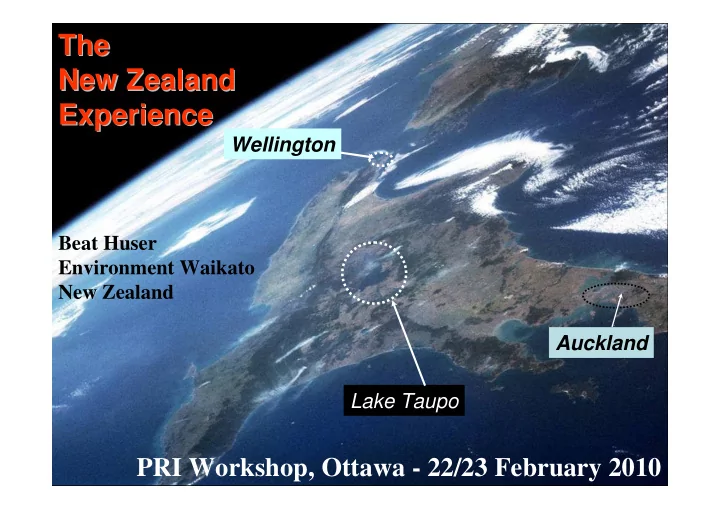
Lake Taupo Auckland
The The New Zealand New Zealand Experience Experience
Wellington
PRI Workshop, Ottawa - 22/23 February 2010
Beat Huser Environment Waikato New Zealand
SLIDE 2
What about New Zealand?
SLIDE 3
SLIDE 4 What we will cover
- New Zealand’s governance
- Role of central (federal) and local government
Two projects:
- 1. Creating Futures project (strategic planning tools)
- 2. Protecting Lake Taupo (innovative policy)
Concluding observations:
– Role of federal (national/central) government – Science and policy interface
SLIDE 5
The Structure of Government
Central Government Unitary Councils Combined Regional and City/District Councils City Councils District Councils Regional Councils Community Local Government
SLIDE 6 Central Government
- Elected by the people (as a nation)
- Decide national policy and make laws (social, cultural,
economic and environmental)
– for the whole of New Zealand
- Supported by non-elected officials
– Provide policy advice
SLIDE 7 Local Government Regional & City/District Councils
Regional Councils (12)
- Natural boundary based on watersheds
- Core business - natural resource management
- air, land, water, coast
District / City Councils (68)
- Boundary based on community of interest
- Core business - land use, economic development,
service delivery
- water supply, sewerage, refuse collection, roading, parks
SLIDE 8 Central Government – Key Agencies
Environment
Ministry for the Environment Department of Conservation
Economic
Treasury Reserve Bank Ministry of Economic Development
Social
Ministry of Social Development Ministry of Health
SLIDE 9
SLIDE 10
SLIDE 11 Relationship Between Policy Instruments
Prevent this (regulation) Encourage this
(education/economic) Sustainable Sustainable Unsustainable Unsustainable
SLIDE 12 Auckland Hamilton Wellington Christchurch Taupo
Waikato Region
Part I – Creating Futures project
Strategic Planning Tools
SLIDE 13
- 25,000 km2 total area
- 1,150 km coastline
- Longest river, largest lake
- 400,000 people (10% of NZ)
- $10 Billion GDP (10% of NZ)
- $ 6 Billion Agriculture Export
Waikato Region - what we manage
SLIDE 14
15% Maori - and increasing
SLIDE 15 Lake Taupo Lake Taupo
Hamilton Taupo Hamilton Taupo
Native forest, scrub and tussock
Key
Vegetation Cover
1840 and Today
SLIDE 16 56% pastoral farming 12% plantation forestry 28% indigenous vegetation and wetlands < 1% horticulture < 1% urban uses
Land Use
Waikato in 2050
SLIDE 17
Coromandel Residents – 25,000 Summer peak – 150,000
SLIDE 18
Whitianga in 1950s
SLIDE 19
Now - 2007
SLIDE 20
Future - 2030
SLIDE 21 Future - in 500 years …
What people value: “The natural environment and lifestyle the Coromandel offers”
SLIDE 22
The ‘futures landscape’ is one of shifting sands
We can’t predict the future ….
SLIDE 23 The path between the present and the future is not clear and direct
Free trade with China Energy Shock Technology Development Terrorist attack
Actual Future State Expected Future State Present State
‘Failure’ of a Pacific nation Economic downturn
SLIDE 24
Creating Futures (2006 – 2010) Project Aim
Develop and apply planning and communication tools to make informed choices for the future
SLIDE 25 1. LONG TERM planning and enhanced strategic focus 2. LINKING Science to Policy
- Evidence-based
- Informed decision-making
3. INTEGRATION
– Strategic partnerships – Linking the four well-beings
Economy Society Environment Culture
Key Features
SLIDE 26
Cultural Environmental Social Economic
WELL-BEINGS
SLIDE 27 OBJECTIVE 1: Improved communication & deliberation tools OBJECTIVE 2: Spatial decision support system development
Project Structure
Project Leader
Advisory Group
Central and local government
SLIDE 28 Key Project Tools
- Scenarios
- Deliberation Process
- Computer Model
(Decision Support Systems) WISE
SLIDE 29 WISE (Waikato Integrated Scenario Explorer)
- Stand-alone software application
- System of interacting models
SLIDE 30 Model library:
Land use local level Hydrology Regional interaction Transport Population (Age cohort) Plant growth Climate
Product
Geonamica
Dynamic and Spatial Modelling
WISE
Input – Output (Economy-Environment) Source: RIKS 2006
Basic Framework
SLIDE 31 Society Economy Environment
Resources Wastes Goods Labour Services Stewardship
Spatially-Explicit
Stocks Flows
Dynamic
Interdisciplinary
SLIDE 32 Multi-scale
Region District Local
(200 x 200 m cells)
Place
SLIDE 33 NZ & World
Waikato Region Dynamic Economy- Environment Model
NZCEE
External Drivers
External Sources
Water Quality
NIWA
Demography
UoW-PSC
Zoning
District Councils
Biodiversity
LCR
Spatial Indicators Climate Change Scenarios
NIWA
Land Use
RIKS/LCR/EW
SUITABILITY ACCESSIBILITY LOCAL INFLUENCE
WISE Beta System Design
Region District Local
GEONAMICA Framework - RIKS INTEGRATION - LCR
LEAD
Hydrology
NIWA
SLIDE 34 3 Mock Scenarios for Waikato’s Future 2001-2050 based on WISE Prototype
Dairy Expansion Diversification Village Life
Residential land increases 7-fold
Land Use
Abandoned Bare Ground Broad-Acre Forestry Infrastructure Mine Indigenous Vegetation Pastoral - Dairy Pastoral - Other Other Primary Residential Water Wetland Utilities Services Manufacturing Construction
Demand for non-dairy primary production land increases Land for dairying increases ~4% annually
Source: Landcare Research & RIKS 2007
SLIDE 35 How WISE helps Environment Waikato
- Explore alternative policy options for regional planning,
assess trade-offs and prioritise issues
- Regional development and sub-regional strategies (non-
statutory) - Future Proof project
- Cumulative effects of policy and permits (over space/time)
- Up-to-date data and information
- Access to expert knowledge from all disciplines
SLIDE 36 Lessons for successful interdisciplinary
multi-agency science/policy collaboration (so far):
- Allow significant time at the start of a project to develop shared
understanding, a holistic project vision and strong relationships
- End user engagement from the beginning is absolutely critical.
Involve the ‘right people’ (champions, networkers, strategic thinkers)
- Develop uptake and implementation strategy to optimize end
users buy-in through:
Improving knowledge of tools Making tools relevant (case studies), useable and credible Provide support data management, training, model set-up Collaboratively identify and implement improvements
SLIDE 37
www.creatingfutures.org.nz
SLIDE 38 Thanks
FRST – Foundation of Research Science & Technology
Project team members Community Outcomes team Environment Waikato
www.creatingfutures.org.nz