
SLIDE 1
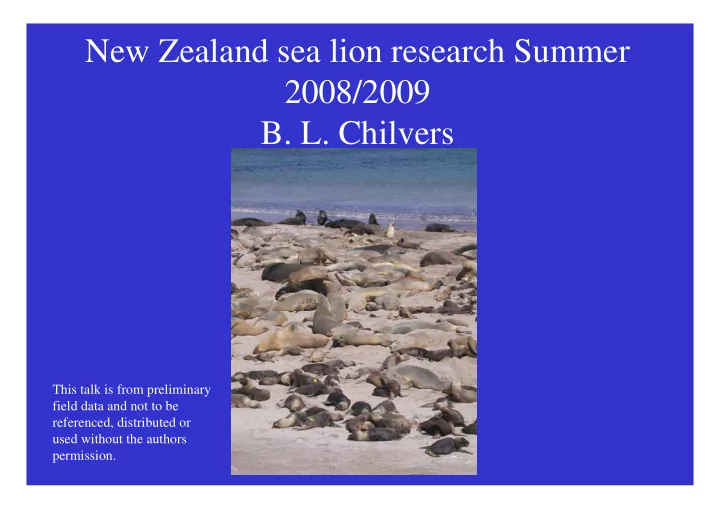
New Zealand sea lion research Summer 2008/2009
- B. L. Chilvers
This talk is from preliminary field data and not to be referenced, distributed or used without the authors permission.
New Zealand sea lion research Summer 2008/2009 B. L. Chilvers This - - PowerPoint PPT Presentation
New Zealand sea lion research Summer 2008/2009 B. L. Chilvers This talk is from preliminary field data and not to be referenced, distributed or used without the authors permission. NZ sea lion research objectives Auckland Islands
This talk is from preliminary field data and not to be referenced, distributed or used without the authors permission.
This talk is from preliminary field data and not to be referenced, distributed or used without the authors permission.
This talk is from preliminary field data and not to be referenced, distributed or used without the authors permission.
– 289+/-2 live pups – 12 dead pups
– 1065 +/- 16 live pups – 67 dead pups
– 8 live pups – 6 dead pups
– 48 live pups – 6 dead pups
This talk is from preliminary field data and not to be referenced, distributed or used without the authors permission.
1200 1400 1600 1800 2000 2200 2400 2600 2800 3000 3200 1996/97 1997/98 1998/99 1999/00 2000/01 2001/02 2002/03 2003/04 2004/05 2005/06 2006/07 2007/08 2008/09 Season Pup Production This talk is from preliminary field data and not to be referenced, distributed or used without the authors permission.
This talk is from preliminary field data and not to be referenced, distributed or used without the authors permission.
5 10 15 20 25 94/95 95/96 96/97 97/98 98/99 99/00 00/01 01/02 02/03 03/04 04/05 05/06 06/07 07/08 08/09 Season % mortality of pups at 1 month
This talk is from preliminary field data and not to be referenced, distributed or used without the authors permission.
5 10 15 20 25 30 35 40 45 9 7 / 9 8 9 8 / 9 9 9 9 / / 1 1 / 2 2 / 3 3 / 4 4 / 5 5 / 6 6 / 7 7 / 8 8 / 9 Season % pup mortality Mortality 1 month Mortality 2 months
This talk is from preliminary field data and not to be referenced, distributed or used without the authors permission.
8.00 9.00 10.00 11.00 12.00 13.00 14.00 2001 2002 2003 2004 2005 2006 2007 2008 2009 Year Weight (kg) Males Females Mean
This talk is from preliminary field data and not to be referenced, distributed or used without the authors permission.
160 210 260 310 360 410 2 9
e c 3 1
e c 2
a n 4
a n 6
a n 8
a n 1
a n 1 2
a n 1 4
a n 1 6
a n 1 8
a n
date Number of cows ashore
2004 2005 2006 2007 2008 2009
This talk is from preliminary field data and not to be referenced, distributed or used without the authors permission.
20 40 60 80 100 120 140 WHITE (14+)
Y w hite (8-9) pink (7-8) red (6-7) blue (5-6) yellow (4-5) AGE CLASS NUMBER O F ANIMALS 2009 PRESENT 2008 PRESENT
This talk is from preliminary field data and not to be referenced, distributed or used without the authors permission.
0.00 10.00 20.00 30.00 40.00 50.00 60.00 W H I T E ( 1 4 + )
a n g e ( 9
) Y w h i t e ( 8
) p i n k ( 7
) r e d ( 6
) b l u e ( 5
) y e l l
( 4
) 2009 % PUP 2008 % PUP
This talk is from preliminary field data and not to be referenced, distributed or used without the authors permission.
10 20 30 40 50 60 70 Orange (9-10) Y White (8-9) Pink (7-8) Red (6-7) Blue (5-6) Yellow (4-5)
Age Class Number of identifiable males
2009 2008
This talk is from preliminary field data and not to be referenced, distributed or used without the authors permission.
This talk is from preliminary field data and not to be referenced, distributed or used without the authors permission.