SLIDE 1 NATIONAL INITIATIVE ON CLIMATE RESILIENT AGRICULTURE (ANNUAL REPORT 2011-12) Centre: Central Rice Research Institute, Cuttack-753 006, Orissa.
- I. Thematic Area: Evaluation of key rice germplasm for tolerance to submergence, drought and salinity
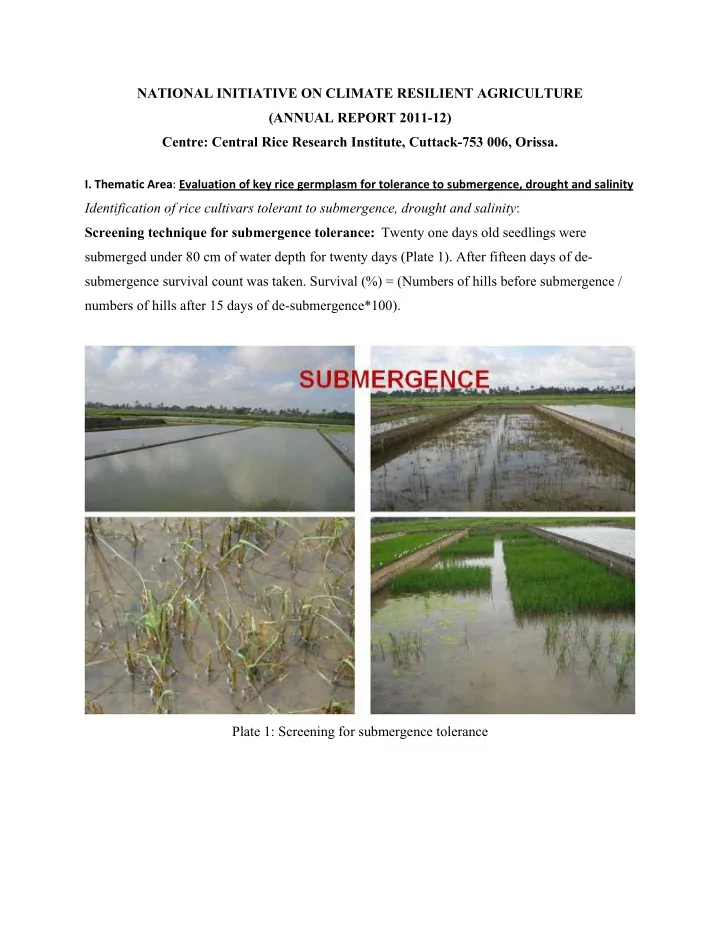
Identification of rice cultivars tolerant to submergence, drought and salinity: Screening technique for submergence tolerance: Twenty one days old seedlings were submerged under 80 cm of water depth for twenty days (Plate 1). After fifteen days of de- submergence survival count was taken. Survival (%) = (Numbers of hills before submergence / numbers of hills after 15 days of de-submergence*100). Plate 1: Screening for submergence tolerance
SLIDE 2
Screening for anaerobic germination: Just after direct seeding the submergence was provided with 10-15 cm of water depth both under laboratory and field conditions (Plate 2). The cultivars which germinated under 10 cm depth of water and successfully emerge above the water surface after 20 days of submergence treatment were considered tolerant to anaerobic germination. Plate 2: Screening for anaerobic germination Screening for waterlogging tolerance: Plants were grown under direct seeding condition. After 60 days of sowing partial submergence was provided with 50 cm of water. Cultivars tolerant to waterlogging were identified based on several yield attributing characteristics and grain yield. Screening for drought tolerance: Screening for drought tolerance was done under field condition during Ravi season (Plate 3). Soil moisture content, rainfall pattern as well as soil water depth were noted during the experiment. Survival percentage due to the imposition of drought and faster recovery growth were considered to identity drought tolerant cultivars.
SLIDE 3 Screening for salinity tolerance at seedling stage: Plants were grown under hydroponic
- condition. Salt stress was applied with 12 dS m-1. Tolerant genotypes were identified based on
the 1-9 scale scoring (1, resistant; 3, tolerant; 5, moderately tolerant; 7, moderately susceptible and 9, susceptible). Plate 3: Screening for drought and salinity toelrance
SLIDE 4 The names of the cultivars tolerant to different abiotic stresses are given in Table 1. Table 1: Numbers of cultivars tested for different abiotic stress conditions and their names.
Abiotic stress
genotypes Name of the tolerant cultivars
- I. Submergence (~Excess water)
A. Anaerobic germination 236 Survival percentage of the following cultivars was more than 90 percent. AC34245, AC34280, AC40331(A), AC40346, AC41622(A), AC41647, AC41644(A), AC41644(B), AC39397, AC39418, AC39416(A). B. Waterlogging 240 AC1125(A), AC1781, AC1996, AC813, AC85, AC39416(A). C. Complete submergence for three weeks 20 Survival percentage after 20 days of submergence was more than 80 percent in the genotypes namely, AC38575, AC37887, IC258990, IC258830, AC42087, and AC20431(B).
- II. Drought (~Deficit water)
A. Vegetative stage 100 IC568024, IC568009, IC568114, IC568060, IC568016, IC568030, IC568083, IC568112 and IC568065. B. Reproductive stage 204 CR 143-2-2, IR 55419-04, Mahulata, IR77298-14-1-2-10, IR83614-1001-B- B, CT9993-5-10-1-M, IR72667-16-1- B-B-3, and IR 80461-B-7-1.
A. Seedling stage 62 Highly salt tolerant genotypes -FL478, Korgut, Chettivirippu (AC39389), Chettivirippu (AC39394). B. Reproductive stage 8 Pokkali (AC41485), Chettivirippu (AC39389) and Chettivirippu (AC39394)
- IV. Tolerant to both anaerobic germination and salinity
A. Anaerobic germination & saline stress 28 AC39416(A), Kamini, Ravana, Talmugra, Langalmutha, Paloi, Murisal and Rashpanjor
- V. Tolerant to anaerobic germination, waterlogging and salinity: AC39416(A)
SLIDE 5
Hybridization programme to utilize the stress tolerant genotypes for developing population to identify new QTLs and high yielding cultivars: On the basis of stable performance under drought, three genotypes namely CR 143-2-2, IR 55419-04, Mahulata were selected as drought donors. Selected recipient genotypes (e.g. IR20, Ratna, Dandi, Swarna and Sahabaghidhan) and drought donors were sown at different dates for synchronous flowering. Following cross combinations were attempted during wet season 2011. F1 generation is already transplanted in field to develop F2 segregating generation. Likely, highly salt tolerant lines, FL478, FL496, SR26B, Korgut and Chettivirippu were hybridized with Swarna-Sub1, Savitri-Sub1, Naveen, IR64, MTU1010. F1 seeds from 20 different cross combinations have been derived. 1000 single tolerant seedlings were identified from three populations and rescued to the experimental fields. Seeds were harvested from tolerant plants. Three bulk population (F5) derived from crosses involving Saltol introgression lines were sown in Simulation tank with EC 12-14dS m-1 along with susceptible check IR29 and tolerant counterpart FL478 to screen populations for seedling stage salt tolerance. Mechanism of waterlogging tolerance: In general maturity date shifted significantly due to waterlogging in waterlogging susceptible genotypes. Changes of different yield and yield attributing characteristics of Mother shoot were not so prominent, however, per unit area basis there was great reduction in panicle numbers and grain yield production. Sterility (%) and plant height increased due to waterlogging compared to control condition mainly in susceptible genotypes. Among the four cultivars reduction of grain yield under waterlogging was greater in Swarna-Sub1 (61.9%), followed by Savitri (61.4%), Savitri-Sub1 (39.2%) and Swarna (23.3%). It showed that cultivars with submergence tolerant QTL SUB1 behaved differently. Introduction of SUB1 QTL increased the waterlogging susceptibility in Swarna whereas in Savitri waterlogging susceptibility decreased. The activities of three carbohydrate metabolic enzymes viz. ADP glucose pyrophosphorylase, Sucrose synthase and Sucrose phosphate synthase decreased greatly under watlogging condition compared to the control condition greatly in susceptible cultivars compared to tolerant cultivars. The activities of antioxidant enzymes in most of the cases were greater in control condition compared to the waterlogging condition. Release of ethylene was greater under waterlogged condition compared to normal condition. Under waterlogging condition release of ethylene was greater in Swarna-Sub1 and Savitri compared to Swarna and Savitri-Sub1, respectively.
SLIDE 6
Testing of rice genotypes tolerant to three weeks complete submergence for SUB1 markers: ART5 a closely linked indel marker when used a 200 bp fragment of SUB1 found in the promoter region of SUB1C in 11 rice genotypes such as Swarna-Sub1, IR64-Sub1, SambaMahsuri-Sub1, INGR04001, INGR08110, AC258830, AC42088, AC20431-W, INGR08109, INGR08111 and FR13A (Fig. 1). The primer SC3 closely linked with SUB1A showed distinct band in 15 genotypes. A few genotypes Swarna-Sub1, IR64-Sub1, Sambamahsuri-Sub1, AC258830, AC42088, INGR08109, INGR08111 and FR13A showed distinct band both for SC3 and ART5. The primer SC3 did not show any marker associated band in submergence tolerant genotypes namely, INGR08110, INGR04001 and AC20431-W. The primers such as SC3 and ART5 did not show any SUB1 associated bands in susceptible cultivars IR42 and Swarna. No clear cut allelic difference was obtained with SC3 and ART5 markers between SUB1 introgression lines and other submergence tolerant genotypes. The genotypes (e.g. AC38575, AC37887, IC258990, IC258830, AC42087, and AC20431(B), which showed more than 80 % survival after 20 days of submergence possessed almost double the quantities of non-structural carbohydrate contents before submergence compared to SUB1 introgression lines. Survival percentage after 20 days of complete submergence was 12, 30 and 14 % in Swarna- Sub1, IR64-Sub1, SambaMahsuri-Sub1, respectively.
SLIDE 7 Mechanism of drought tolerance: Stress treatment was applied by adding PEG solutions of different osmotic potential (0, - 2, -5 and -10 Bars) to the 5 days old seedlings for 5 days and then the stress was released by re- irrigating the seedlings. The status of protein, proline, total chlorophyll and peroxidase activity along with shoot and root traits were recorded on 5th day after stress. In general, soluble protein and chlorophyll content decreased while proline content and peroxidase activity increased with the increase in severity of stress. The activities of peroxidase under stress were associated with moisture stress tolerance. Shanti Joha, Khamti Joha, Jangia, Amro, CR-143-2-2 and Vandana are found promising on the basis of shoot length, root length, shoot/root length ratio and number of lateral roots. In the present investigation based on the above drought tolerant traits, Srilanka, Shillong Andeng, Nania, Shanti joha, Jangia, CR143-2-2 and Vandana were identified as drought tolerant genotypes, which could withstand the osmotic stress up to -10 bars at seedling stage. Mechanism of salinity tolerance: Sodium potassium ratio in shoot was 0.18-0.21 % and 0.18-0.30 % in highly salt tolerant (score 3) accessions such as FL478, Korgut, Chettivirippu (AC39389), Chettivirippu (AC39394) and moderately salt tolerant (score 4-5) accessions such as Talmugur, Kamini, Matchal, Rupsal, Marisal, Gitanjali, Agniban, Matla, Patnai-2, Chettivirippu (AC 39388), respectively. Allelic diversity and identification of molecular markers associated with salt tolerance: One unique haplotype at 415bp was identified in Chettivirippu (AC 39389) by RM
- 10772. RM10745 delivered a haplotype at 200bp in FL478 which was found common to only
tolerant genotypes such as Pokkali (AC39416), Chettivirippu (AC39388) and Hasawi. The same primer produced another haplotype (205bp) which was only present in highly tolerant genotypes such as Pokkali (AC41585) and Chettivirippu (AC39389). RM10745 could be used as one of the key primers for marker assisted selection for saltol QTL using identified tolerant haplotypes in FL478, Pokkali or Chettivirippu. Graphical representation of genetic diversity of germplasm in saltol region was done by Principal Component Analysis, which suggested that Chettivirippu (AC39389) and Pokkali (AC41585) were distantly located in respect of other genotypes including FL478. Like UPGMA dendrogram, FL478 was also found closer with Pokkali (AC39416) in 2D plot. Their locational proximity could be explained by the possession of similar introgressed fragment, responsible for
SLIDE 8 salt tolerance. PCA depicted that highly salt tolerant accessions such as Pokkali (AC41585) and Chettivirippu (AC39389) were distantly located in 2D plot in respect of another highly tolerant group comprising FL478 and Pokkali (AC39416). Moderately tolerant lines such as Kamini, Talmugur and Hasawi were found in three distant locations in 2D plot. Kamini and Talmugur were also found distant from this group. This allelic diversity in saltol locus in respect of FL478
- r Pokkali could be utilized by introducing those identified salt tolerant lines in breeding for
developing salt tolerant lines. Hybridization programme and selection of materials: On the basis of stable performance under drought, submergence and salinity different genotypes were used in hybridization for the development of high yielding stress tolerant varieties and mapping populations. Selected recipient genotypes and donors for different abiotic stresses were sown at different dates for synchronous flowering. F1 generation is already transplanted in field to develop F2 segregating generation. Segregating generations will be tested under control and specific stress conditions to know the yield potential and tolerance level in consequent season. Bulk population (F5) derived from crosses involving saltol introgression lines were tested in simulation tank with EC 12-14 dS m-1 along with susceptible check IR29 and tolerant counterpart FL478 to screen populations for seedling stage salt tolerance.
- II. Thematic area: Monitoring of GHGs emissions in rice based production systems and
Evaluation of crop management options for their GHG mitigation potential. Improved estimates of GHG emissions in rice based production systems: i) Monitoring of carbon dioxide (CO2) exchanges from lowland submerged rice fields: Diurnal and seasonal variation of Net Ecosystem Exchange (NEE) and CO2 concentration: The CO2 concentration in the atmosphere varied from 360 to 385 µmol mol-1 during the entire course of study. The eddy covariance based CO2 flux measurement was done continuously from vegetative stage to just before harvest of the crop. The season-long integrated NEE value was -414 g C m-2. Over the season diurnal variations of mean NEE values varied from 3.5 to - 18.7 µ mol CO2 m-2 s-1, where positive sign indicated net CO2 emission into the atmosphere and negative sign denoted net CO2 assimilation or uptake by the crop. Maximum CO2 assimilation or uptake by rice crop was found at 13.30 hrs during the whole cropping season and maximum
SLIDE 9 emission was observed at 4.00 hrs. Almost over the entire season rice crop behaved as net CO2 sink except few days during the maturity period. The amplitude of the daily variation in NEE increased and reached its peak around the anthesis and / or heading to flowering stage and, then
- n, decreased gradually till maturity.
Air temperature and NEE: CO2 exchange was influenced by surface air temperature. Maximum CO2 uptake was
- bserved between 170C and 370C and its uptake gradually decreased beyond 370C suggesting a
decline in photosynthetic rate. Daytime photosynthetic C assimilation, night time respiratory C loss and net ecosystem production: The net ecosystem production was correlated with the carbon assimilation by the flooded rice paddy ecosystem during daytime throughout the study. The average Net Ecosystem Production (NEP) of flooded rice paddy ecosystem was 43.6 Kg C ha-1 d-1 whereas average net nocturnal carbon release by the ecosystem through respiration was 18.9 Kg C ha-1 d-1. NEP showed significantly positive correlation with 12 hour daytime carbon uptake by photosynthesis and also with nocturnal carbon release through respiration from rice paddy ecosystem. Carbon accumulated in 12 hours was calculated by summing the NEE during 12 hour daytime. Carbon absorbed during daytime by plants is the gross primary production (GPP). The difference between GPP and respiration is the NEP. Difference between carbon gain in daytime 12 hours by photosynthesis and NEP gives the quantity of carbon released by ecosystem during respiration. ii) Methane (CH4) emission from flooded rice field A field study was carried out on methane (CH4) flux measurements under submergence system (cv. Gayatri) for 129 days by closed chamber method. The fluxes of methane under submerged condition (cv. Gayatri) varied significantly between 0.41-4.51 mg m-2 h-1 during the observation period. Initially (at 10, 20 DAT) the fluxes were low at all the treatments but increased significantly with the successive growth stages of crop development. The highest fluxes were observed at 87 DAT of 4.51 mg m-2 h-1. The capacity of CH4 production was likely to depend on available C resources for microbes. It has
SLIDE 10 been well addressed that under submerged condition along with the application of organic or inorganic fertilizers could enhance the bio-available pool of organic carbon and, in turn, the CH4 production increased due to greater utilization of organic carbon by methanogenic microbes. Management practices to reduce emissions from paddy cultivation: Evaluation of improved crop management options for their GHG mitigation potential: A field trial was conducted in Kharif 2011 under rainfed condition with two long duration varieties Ranjit (V1) and Swarna-Sub1 (V2) with three Nitrogen doses (T1, no nitrogen; T2, 120 kg Nha-1 (60kg basal, 30 kg at Maximum Tillering, 30 kg at Panicle Initiation; T3, LCC based N application schedule (30 kg at 14 DAT, 30 kg at 47 DAT, 30 kg at 67 DAT, when LCC reading< 4.0). Observations of plant parameters like length of tiller, number of tiller, above and below ground plant biomass were taken at Active tillering (AT), Panicle initiation (PI), flowering (FL)
- stages. Gas sampling for estimation of N2O-N emission was done immediately after application
- f fertilizer for four consecutive days and after that at an interval of seven days. Significant
difference between the varieties with respect to plant height, no of tiller and above ground plant biomass was recorded. The N2O peak rate of emission was observed 2-3 day after fertilizer application. Highest rate of emission (71 µg N2O-N m-2 hr-1) was recorded in V2T2 at 67 Days after transplanting. In Control plots emission ranged 7-20 µg N2O-N m-2 hr-1. In All treatment towards the end of the season emission increased as probably field dried due to lack of rain fall. Depending upon N treatment and variety total seasonal emission ranged from 0.26 kg ha-1 to 0.83 kg ha-1. Under both the variety T2 treatment resulted highest emission. LCC based N application (T3) resulted 23-24 % less N2O emission in comparison to T2. N uptake and N recovery efficiency: Total crop N uptake (kg ha-1) was calculated after the harvest of crop. Uptake was higher in fertilizer applied treatments. No significant difference could be observed between T2 and T3 treatment with respect to N uptake however recovery efficiency of applied N was higher under T3 in both the varieties as compare to T2. The effect of variety on N uptake and N recovery efficiency was non-significant.
SLIDE 11 Yield, GWP per unit yield: Highest yield (averaged over the variety) was observed under T2 followed by T3 and T1 (Table 2). Global warming potential (GWP) per unit yield under T3 was lower than the T2 in case of both the varieties. Table 2. Yield and Global warming potential per unit yield under different N application strategy Treatment
Yield (t ha‐1) GWP per unit yield Ranjit Swarna‐Sub1 Mean Ranjit Swarna‐Sub1 T1 3.3 3.6 3.4 0.027 0.022 T2 4.9 4.6 4.8 0.045 0.054 T3 4.0 4.4 4.2 0.041 0.041 Mean 4.1 4.2
0.039
C.D.(5%) Variety (V) 0.35 NA Treatment(T) 0.45 NA VxT 1.09 NA
SLIDE 12 Publication: Sarkar, R. K., B. Bhattacharjee (2011). Rice genotypes with SUB1 QTL differ in submergence tolerance, elongation ability during submergence, and re-generation growth at re-
- emergence. Rice, DOI 10.1007/s12284-011-9065-z.
Dash, G. K., M. Barik, R.K.Sarkar, P. Swain (2012). Effect of polyethylene glycol induced
- smotic stress on seedling growth of different rice cultivars. In: Proceeding of the
National Symposium on “Rice Based Farming Systems for Livelihood Security under Changing Climate Scenario”, College of Agriculture (OUAT), Chiplima, Sambalpur, Orissa, 27th -29th February 2012. Kuanar, S. R., C. R. Barik, E. Kariali, R. K. Sarkar, P. K. Mohapatra (2012). Tiller dynamics of two wild relatives of cultivated rice in diversified habitats. In: Proceedings of the National Symposium on “Plants Stress Management”, Botany Department, Utkal University, Bhubaneswar, pp. 103-107. Seminar/Symposium participated Sri Goutam Kumar Dash, SRF participated in National Symposium on “Rice Based Farming Systems for Livelihood Security under Changing Climate Scenario” at College of Agriculture (OUAT), Chiplima, Sambalpur during 27-29 February 2012 and presented a poster.
- Dr. (Mrs.) S. R. Kuanar, RA and Mr. CR Barik, SRF participated in National Symposium on
“Plants and stress Management”, Department of Botany, Utkal University, Bhubaneswar on 27th February, 2012. Extension Bulletin One extension bulletin in three languages such as Hindi, Orya and English were published by Mohanty, S., P. Bhattacharya, A. Kumar, P. Swain, O. N. Singh, K. Chattopadhyay and R. K. Sarkar (2012). Leaf color chart (LCC) for effective nitrogen management and reduction of N2O emission from rice field. NICRA leaflet No. 01, CRRI, Cuttack.