SLIDE 1
More quantitative, dynamical foodwebs Jonsson, Cohen, Carpenter - - PDF document
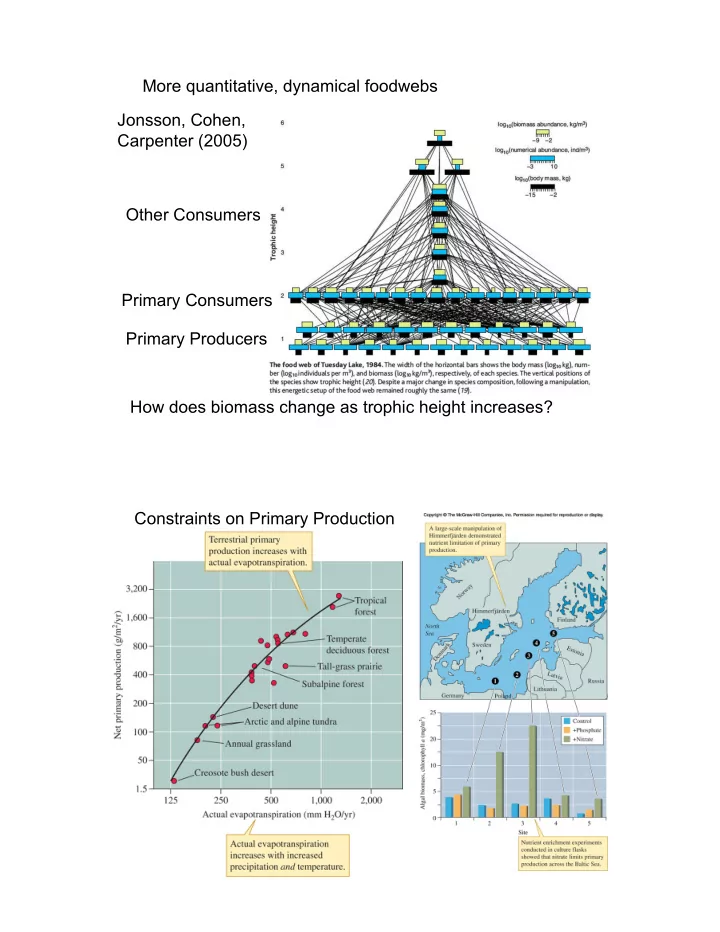
More quantitative, dynamical foodwebs Jonsson, Cohen, Carpenter (2005) Other Consumers Primary Consumers Primary Producers How does biomass change as trophic height increases? Constraints on Primary Production Charles Elton Arthur Tansley
SLIDE 2
SLIDE 3
- 3. Trophic-Dynamic
view of Cedar Bog Lake Gosz et al. 1978 - Lindeman’s followers
SLIDE 4
Ecosystem feedbacks Top-down vs. bottom-up Trophic Cascades (Lakes) Carpenter and Kitchell (Serengeti) McNaughton et al.
Figure 18_12
SLIDE 5
Plant biomass Degradable Detrital mass Refractory Detrital mass Net Primary Production Herbivore grazing web Detrital web Import Export Decomposition Refractory Accumulation Partitioning of net primary production (Cebrian 1999) Compared across all sorts of ecosystems… Bottom-up effects Plant N and P, and herbivory (Cebrian 1999) Think stoichiometry! Increasing C:N, C:P
SLIDE 6
Detrital production and refractory accumulation (Cebrian 1999) Increasing C:N, C:P C:N or C:P Fraction of NPP % N or P high low Questions: Which end of the spectrum is terrestrial
- vs. aquatic?
Which line is
- a. Herbivore chain
- b. Detrital chain
- c. Refractory storage
Now make a prediction low high
SLIDE 7
Predict differences between Lindeman’s two chains
- 1. Phytoplankton
- 2. Macrophyte
Predict differences between Lindeman’s two chains
- 1. Phytoplankton
- 2. Macrophyte
Lower C:N, C:P Higher C:N, C:P
SLIDE 8
BIOTIC AVAILABLE UNAVAILABLE
CARBON
SLIDE 9