
SLIDE 1
Monitoring and Analysing Professional Speed Skaters Jac Orie Arno - - PowerPoint PPT Presentation
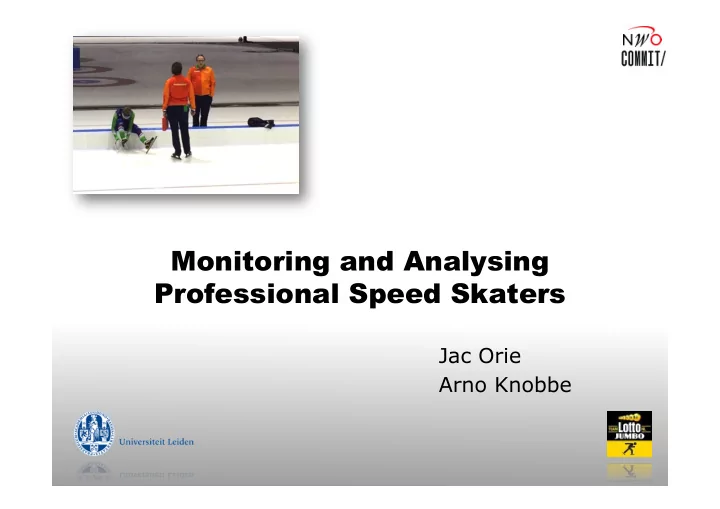
Monitoring and Analysing Professional Speed Skaters Jac Orie Arno Knobbe LottoNL-Jumbo Speed Skating Team Skaters: Sven Kramer, Wouter Olde Heuvel, Kjeld Nuis, Some 16 Olympic medals + numerous championships Why? WE WANT TO WIN
Skaters: Sven Kramer, Wouter Olde Heuvel, Kjeld Nuis, … Some 16 Olympic medals + numerous championships
Simultaneous development of many abilities
Adaptation of too many stimuli bad results Distance/event specific Athlete-specific
Male vs. female Individual physique
Issurin
Issurin
Accumulation Transmutation Realisation 12-30 days 12-25 days 8-14 days competition Meso-blocks residuals
Issurin
0.98 0.99 1.00 1.01 1.02 1.03 1.04 1.05 1.06 1.07
time_relative
0.0 2.5 5.0 7.5 10.0 12.5 15.0 17.5 20.0 22.5 25.0 27.5 30.0
density
test moment
tapering
How many exercises?
(duration, load) How many minutes, …?
(duration, intensity, load) Did you recently …?
(duration, intensity, load) How varying was …?
Sum of duration over 14-day period Max of intensity over 2-day period Sum of duration over 21-day period, morning sessions Sum of duration over 21-day period, intensities 6, …, 9 Maximum of load over 7-day period, cycling …
¡
Each variable will have a U-shape Neither too little, nor too much In theory non-linear, in practice only a sample
linear model threshold model
training load
relative time available data
Each variable will have a U-shape Neither too little, nor too much In theory non-linear, in practice only a sample
linear model threshold model
training load
relative time
178 races On average 2.89% above track record Specialises on 1000 m (2.1%) 2015-2016
Dutch champion 1000 m, 1500 m WC Distances: bronze 1000 m, silver 1500 m WC Sprint: ‘silver’ ISU World Cup: gold 1000 m, silver 1500 m
250 500 750 1,000 1,250 1,500 1,750 2,000
sum_load_am_5
0.9975 1.0000 1.0025 1.0050 1.0075 1.0100 1.0125 1.0150 1.0175 1.0200 1.0225 1.0250 1.0275 1.0300 1.0325 1.0350 1.0375 1.0400 1.0425 1.0450 1.0475 1.0500 1.0525 1.0550
time_relative
undesired result due to over-training
Parameter fitting on a physiological model of
0" 5" 10" 15" 20" 25" 30" 35" 40" "fa*gue" "fitness" "kernel"