SLIDE 1
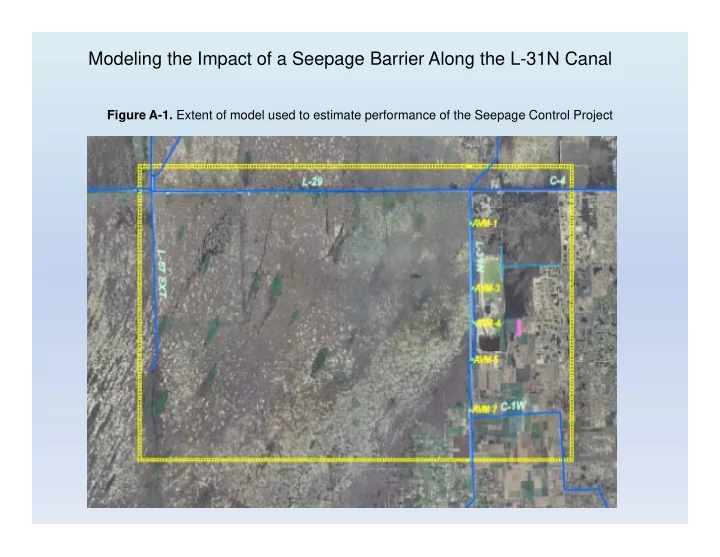
Modeling the Impact of a Seepage Barrier Along the L-31N Canal
Figure A-1. Extent of model used to estimate performance of the Seepage Control Project
SLIDE 2 Table A‐1. Model Layering and Hydraulic Conductivity
d l l Thickness Thickness Horizontal Vertical Model Layer Bottom Elev (ft NGVD) Thickness at L‐31N (ft) Thickness at L‐67ext (ft) Note Horizontal Conductivity (ft/d) Vertical Conductivity (ft/d) 1 Land Surface NA NA Wetland layer 2.0E+07 2.0E+06 Surface 2 5.00 Variable Variable Muck layer 150 150 3 ‐5.00 10.00 5.65 Flow Zone 1 (Miami
Limestone)
12,500 1,250 4 ‐7.00 2.00 1.13 Hard Layer 1 (Q4) 5 5 5 ‐9.00 2.00 1.13 Flow Zone 2 (Upper
25,000 2,500 6 ‐17.00 8.00 4.52 Flow Zone 2 (Upper
25,000 2,500 7 ‐19.00 2.00 1.13 Hard Layer 2 (Q3) 5 5 8 ‐29.00 10.00 5.65 Flow Zone 3 (Middle
25,000 2,500 9 ‐31.00 2.00 1.13 Hard Layer 3 (Q2) 5 5 10 ‐41.00 10.00 5.65 Flow Zone 4 (Lower
25,000 2,500
SLIDE 3
Figure A-2. Model grid showing major landscape features.
SLIDE 4
Figure A-3. Cross section of Model Grid showing major features. Figure A-5. Sketch of flow distribution from L-29 to ENP.
SLIDE 5
Figure A-4. Location of monitoring well locations used in the analysis.
SLIDE 6
Figure A-6. Area within Everglades National Park affected by a 7 mile long, 30 foot deep barrier during a typical wet season (average daily stage data from 7/1/2008 through 10/31/2008).
SLIDE 7
Table A-2. Aerial extent, in acres, of increased water level in ENP in response to various 7 mile Table A 2. Aerial extent, in acres, of increased water level in ENP in response to various seepage barrier configurations for a typical wet season. Stage Change Category 7 mile Barrier 30 Feet Deep 7 mile Barrier 30 Feet Deep (West Wellfield ‐ 40 MGD) 7 mile Barrier 18 Feet Deep 2 mile Barrier 30 Feet Deep 1.5 mile Barrier 30 Feet Deep 1 mile Barrier 30 Feet Deep
.05‐.1 12,242 12,276 10,410 9,537 5,056 1,835 .1‐.2 11,930 12,076 4,397 2,723 1,311 213 .1 .2 11,930 12,076 4,397 2,723 1,311 213 .2‐.3 5,429 5,287 159 415 137 .3‐.4 2,495 2,425 , , >.4 881 855
SLIDE 8 Figure A-7. Model Result: Average annual flow diverted south by the L-31N Canal between the Tamiami Trail and G-211.
90 70 80
Base Condition
40 50 60
0 Acre‐Feet Base Condition 18 Foot Barrier
20 30 40
1,000 30 foot Barrier
10 20
Annual
SLIDE 9
Figure A-8. Model Result: Average annual flow through the four flow zones at the eastern boundary of ENP with and without a 30 foot deep 7-mile long barrier. eastern boundary of ENP with and without a 30 foot deep 7 mile long barrier.
SLIDE 10
Figure A-9. The flow transect used for estimating change in sheetflow as a result of the seepage barrier are shown in red.
SLIDE 11
Figure A-10. Estimated net flow across the transect shown in Figure A-9, with and without the 7-mile, 30 foot deep seepage barrier.
SLIDE 12
Table A-3. Net change in flow through Northeast Shark River Slough at the transect in Figure A-9, as a percentage of the base flow. Shallow indicates a barrier depth of 18 feet and deep indicates a depth of 30 feet. The numbers following the depth designations refer to the length of
Average Percent Change in Flow for Various Seepage Barrier Configurations
the barrier, in miles, from Tamiami Trail to the south. Season Shallow-7 Deep-7 Deep-2 Deep-1.5 Deep-1 Deep-7 (40 MGD) N t Annual 8.7% 27.8% 8.2% 5.8% 3.2% 27.0% Net Change for NESRS Wet 12.2% 37.5% 11.0% 7.7% 4.4% 36.1% Dry 5.6% 19.3% 5.6% 4.0% 2.1% 19.0% Annual 1.9% 5.9% 1.9% 1.5% 0.9% 5.8% Change at North- South Transect Wet 2.5% 7.5% 2.4% 2.1% 1.3% 7.4% Dry 1.3% 4.4% 1.4% 1.0% 0.5% 4.3% Change at East-West Transect Annual 6.8% 21.9% 6.3% 4.2% 2.3% 21.2% Wet 9.7% 29.9% 8.6% 5.6% 3.1% 28.7% Dry 4 3% 14 9% 4 3% 3 0% 1 6% 14 6% Dry 4.3% 14.9% 4.3% 3.0% 1.6% 14.6%