MISSION CREEK COMMUNITY MEETING Welcome and Introductions - - PowerPoint PPT Presentation
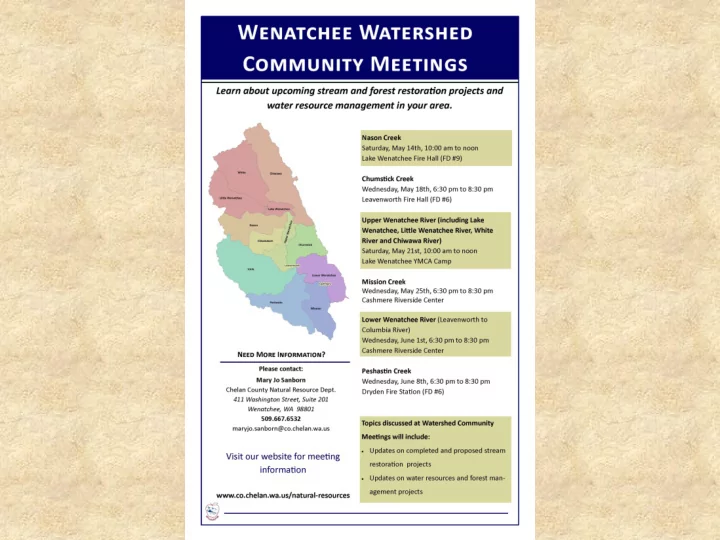
MISSION CREEK COMMUNITY MEETING Welcome and Introductions Background on Watershed Planning and Salmon Recovery Planning Implementation Priorities and Completed Projects Ongoing and Upcoming Efforts Watershed Planning
MISSION CREEK COMMUNITY MEETING
- Welcome and Introductions
- Background on Watershed Planning and
Salmon Recovery Planning
- Implementation Priorities and Completed
Projects
- Ongoing and Upcoming Efforts
Watershed Planning Wenatchee River Watershed
- Planning Process began in 1999 under
RCW 90.82
- Plan Approved in 2006 by local stakeholder
group
- All 4 Elements Included: Water Quantity,
Instream Flows, Water Quality and Habitat
Endangered Species Act (ESA)
- Upper Columbia spring Chinook – 1999
endangered
- Upper Columbia steelhead – 1997
endangered, re-classified as threatened
- Bull Trout - threatened
ESA Efforts
- Development of federal recovery plans
- NOAA-Fisheries and US Fish and Wildlife
Service
- Watershed Planning Units/Watershed
Action Teams
- Upper Columbia Salmon Recovery Board
Implementation
- Meetings, coordination, partners
- Funding mechanisms
- Focus on restoring natural processes in high
priority areas.
Wenatchee River Basin Salmon Restoration Priorities
Assessment Unit Priority Nason Creek 1 Upper Wenatchee River 2 Icicle Creek 3 Peshastin Creek 4 Lower Wenatchee River 5 Mission Creek 6 Little Wenatchee River Not a priority at this time White River Not a priority at this time Middle Wenatchee River Not a priority at this time Chumstick Creek Not a priority at this time Chiwawa River Not a priority at this time
Wenatchee River Basin Salmon Protection Priorities
Assessment Unit Priority Nason Creek 1 White River 1 Upper Wenatchee River 1 Chiwawa River 1 Little Wenatchee River 2 Middle Wenatchee River 2 Icicle Creek 3 Lower Wenatchee River 3 Peshastin Creek 4 Mission Creek 4 Chumstick Creek 4
Mission Creek Recommended Strategy
- Address water quality issues for temperature, fecal
coliform and DDT (TMDL/Water Clean-up Plan)
- Increase water availability for instream and out-of-
stream uses; Implement instream flow rule
- Improve side channel and wetland connections
- Reduce sediment and restore habitat diversity and
complexity
- Riparian restoration – plant native streamside
vegetation/remove noxious weeds
Lower Mission Creek Constraints
- Low stream flows during late summer (dry
in some locations)
- Water temperature, fecal coliform and DDT
levels have exceeded state standards
- Channelization and loss of channel
migration/floodplain function
Fish Use in Mission Creek
Steelhead Spawners modeled by WDFW data incorporating PIT Tag data and redd surveys
Mission Creek PIT Tag Array Hits
2013 2014 2015 2016 Bull Trout 2
- Hat. Coho
9 35 36 12
- Hat. Spring Chinook
3 5
- Hat. Summer Steelhead
5 9 4 3 Hatchery Sockeye 1 Wild Sockeye 1 Wild Spring Chinook 2 1 1 Wild Summer Steelhead 13 31 25 11 TOTAL 32 82 67 28
Data from Ben Truscott of WDFW
Wenatchee Watershed Work Completed to Date
Wenatchee River Instream Flow Rule
- Balances community needs and fish needs
- Established 4 cfs reservation for future use
- Provides reliable year-round domestic water for
20 years
- Wenatchee Water Work Group Efforts to Process
Water Rights
Mission Creek Instream Flow Rule
- Interim Reservation of 0.03 cfs for domestic water
use for two years
- 2008-14 Debit: 30 new wells = 0.0176 cfs (58%)
- 0.0124 cfs remaining in interim reserve
- Instream Flow Improvements are needed to access
full reservation of 0.12 cfs
How do we increase instream flow?
- Conservation and Efficiencies
- Water purchased for Water Trust
- Establish a Water Bank
- Improve Stream Conditions
- Creative water solutions
- Cooperative approach
Ongoing and Upcoming Efforts
- Mission Creek Water Quality Plan
– Water Quality – Habitat – Instream Flow
Riparian Restoration to improve water quality
- 900’ Linear by 35’ buffer width
- Eradication of noxious species, natives
installed
- Long term improvements benefits
Bank Stabilization to reduce erosion, loading & improve habitat
- High flow event in December caused
flows > 600 CFS
- Likely attributable to breach hydrology
associated with past wildfires
- Debris jam accumulated, re-routed Creek
and eroded stream bank and house
- CCNRD was requested to assist in
bank stabilization process
- Local contractor to start Phase 1
stabilization in upcoming weeks
- Phase 2 & 3 will include moving the
building envelop away from County Road and Creek, as well as habitat-
- riented water quality restoration
Bank Stabilization to reduce erosion, contaminant loading & improve habitat
Flow Improvement
- Currently working on feasibility of multiple
- ptions:
– “Pump and Dump” of irrigation wells during low flow period (September/October) – Transfer of use from surface diversions to deep wells – Extension of regional water services to landowners – Extension of regional water services to spill water directly into Mission Creek – Water banking of surface water rights into a trust
- All options shown are continually vetted by landowners
and refined by engineers to arrive at a community supported outcome
Flow Improvement
Community Involvement & Next Steps:
- Assemble Mission Creek Watershed Council
- Continue well testing, flow augmentation pilot
program in Fall 2016
- Voluntary Stewardship Program
- Construct a watershed specific Vegetation
Management Plan to aid in making informed decisions that meet landowner & environmental needs
Contact:
Pete Cruickshank 667-6612 pete.cruickshank@co.chelan.wa.us
Natural Resources Assessment Section Washington State Department of Agriculture http://www.agr.wa.gov/PestFert/NatResources/
Matthew Bischof Natural Resource Scientist
Water Quality and Agriculture in Washington State
“The Washington State Department of Agriculture serves the people
- f Washington by supporting the agricultural community and
promoting consumer and environmental protection.”
Na Natural al Res esour urces As Asses essment S Sect ection n
Who is NRAS?:
- Research group in the Director’s office
- Staff have a wide range of expertise
- Our primary goal is to assess effects of pesticides
- n endangered species and water quality
- Core program data components
–Collect Pesticide Use Information –Agricultural Land use Mapping –Ambient Surface Water Monitoring –Groundwater
- Numerous special projects
24
Water Quality: Surface Water and Groundwater
- Different challenges for each
- Surface water: Mostly pesticide related activities,
ESA and CWA driven
- Groundwater: Pesticide and Nitrate related
activities, e.g. exceeding drinking water standards
2007 2008 2009 2010 2011 2012 2013 2014 2015 Weeks Sampled 31 27 26 27 26 27 27 27 25 Pesticides Detected 7 4 3 2 3 4 11 7 9 Total Detections 10 6 3 3 3 4 11 9 9 Exceedances 1 1 1 3 1 Average Pest. Count 0.32 0.22 0.12 0.11 0.12 0.15 0.41 0.33 0.36
- Max. Count
2 2 2 1 1 1 4 2 2
- Min. Count
5 10 15 20 25 30 35
Mission Creek 2007-2015
Weeks Sampled Pesticides Detected Total Detections Exceedances Average Pest. Count
- Max. Count
- Min. Count
2007 2008 2009 2010 2011 2012 2013 2014 2015 Chlorpyrifos 1 2 Endosulfan 1 1 Etoxazole 1 Pyridaben 1
0.5 1 1.5 2 2.5
Mission Creek Exceedances 2007-2015
Chlorpyrifos Endosulfan Etoxazole Pyridaben
2007 2008 2009 2010 2011 2012 2013 2014 2015 Weeks Sampled 30 27 27 27 27 27 27 27 25 Pesticides Detected 20 16 17 15 16 16 17 18 16 Total Detections 147 131 123 110 99 110 111 54 58 Exceedances 93 83 71 44 53 73 62 28 29 Average Pest. Count 4.9 4.9 4.6 4.1 3.7 4.1 4.1 2 2.32
- Max. Count
15 8 8 9 7 7 7 8 7
- Min. Count
1 2 2 2 1 1 1 20 40 60 80 100 120 140 160
Brender Creek 2007-2015
Weeks Sampled Pesticides Detected Total Detections Exceedances Average Pest. Count
- Max. Count
- Min. Count
2007 2008 2009 2010 2011 2012 2013 2014 2015 DDT 83 71 62 40 52 66 54 25 29 Endusulfan 8 12 7 2 1 6 8 Chlorpyifos 1 2 1 1 3 Azinphos-methyl 1 Diazinon 1 10 20 30 40 50 60 70 80 90
Brender Creek Exceedances 2007-2015
DDT Endusulfan Chlorpyifos Azinphos-methyl Diazinon
Our Questions
- Are the invertebrate/periphyton
communities in Brender and Mission influenced, and to what degree (spp. presence/absents & abundance) by pesticide detections?
- What pesticides are in the GW?
- Possible contribution to surface water?
- Ephemoroptera
Ecoregions
Index of Biological Integrity (IBI)
Percent Dominance = The sum of individuals in the 3 most abundant taxa, divided by the total number of individuals in the sample.
Sampled 7/30/2012
Peshastin Ck
Quantities
Taxa Richness
43
5.5
Fair
Ephemeroptera Richness
14
10
Excellent
Plecoptera Richness
2
1.4
Very Poor
Trichoptera Richness
3
2.5
Poor
EPT Richness
19
n/a
Clinger Richness
25
10
Excellent
Long-Lived Richness
4
2.5
Poor
Intolerant Richness
10
10
Excellent
Percent Dominant
44.2
6.7
Good
Predator Percent
7.6
3.3
Poor
Tolerant Percent
10
7.7
Good
Number of Organisms
500
n/a 59.6
Fair
Very Poor Poor Fair Good Excellent
Metric Scores Overall Score ( B- I BI ) Sampled 7/29/2012
Upper Wenatchee R.
Quantities
Taxa Richness
72
10
Excellent
Ephemeroptera Richness
15
10
Excellent
Plecoptera Richness
4
4.3
Fair
Trichoptera Richness
9
10
Excellent
EPT Richness
28
n/a
Clinger Richness
34
10
Excellent
Long-Lived Richness
4
2.5
Poor
Intolerant Richness
7
10
Excellent
Percent Dominant
38.2
8.3
Excellent
Predator Percent
3.6
1.3
Very Poor
Tolerant Percent
0.2
10
Excellent
Number of Organisms
500
n/a 76.4
Good
Very Poor Poor Fair Good Excellent
Metric Scores Overall Score ( B- I BI )
Upper Columbia Basin – V. Poor vs Excellent IBI
Sampled 8/22/2012
- S. Fork Gold
Ck.
Quantities
Taxa Richness
50
7.9
Good
Ephemeroptera Richness
11
10
Excellent
Plecoptera Richness
10
10
Excellent
Trichoptera Richness
8
8.8
Excellent
EPT Richness
29
n/a
Excellent
Clinger Richness
24
10
Excellent
Long-Lived Richness
11
10
Excellent
Intolerant Richness
10
10
Excellent
Percent Dominant
39.2
8.1
Excellent
Predator Percent
16.4
7.7
Good
Tolerant Percent
10
Excellent
Number of Organisms
495
n/a 92.4
Excellent
Very Poor Poor Fair Good Excellent
Metric Scores Overall Score ( B- I BI ) Sampled 8/27/2012
Yaksum Ck
Quantities
Taxa Richness
25
Very Poor
Ephemeroptera Richness
1
Very Poor
Plecoptera Richness
Very Poor
Trichoptera Richness
Very Poor
EPT Richness
1
n/a
Clinger Richness
4
Very Poor
Long-Lived Richness
2
Very Poor
Intolerant Richness
Very Poor
Percent Dominant
55.4
3.7
Poor
Predator Percent
0.2
Very Poor
Tolerant Percent
3
9.3
Excellent
Number of Organisms
500
n/a 13
Very Poor
Very Poor Poor Fair Good Excellent
Metric Scores Overall Score ( B- I BI )