
10/9/2018 1
Is Is BM BMI a valid lid mea measur ure of
- f obes
- besity
ity in in postmenopausal postmenopausal wo women?
Postmenopausal Women With a “Normal” BMI Might Be Overweight or Even Obese
- 40% of women in USA are obese using BMI as index, but BMI is only a proxy for body fat
- Actual body fat % of most postmenopausal women would classify them as obese, even with BMI < 30
- Using whole body dual x‐ray absorptiometry scans to measure body fat, Banack et al studied and classified
1329 postmenopausal 53 – 85
- Obesity defined as a BMI > 30 or body fat % > 35%, 38%, or 40%
- Most of the women whose body fat percentage was 35% or more which = obesity and at a greater risk of
- besity‐related health problems—had a BMI < 30
32.4% with 35% body fat had BMI > 30, 67.6% did not 44.6% with 38% body fat had BMI > 30 55.2% with 40% body fat had BMI > 30
Banack HR et al Menopause. 2018 March; 25(3): 307–313. doi:10.1097/GME.0000000000000989
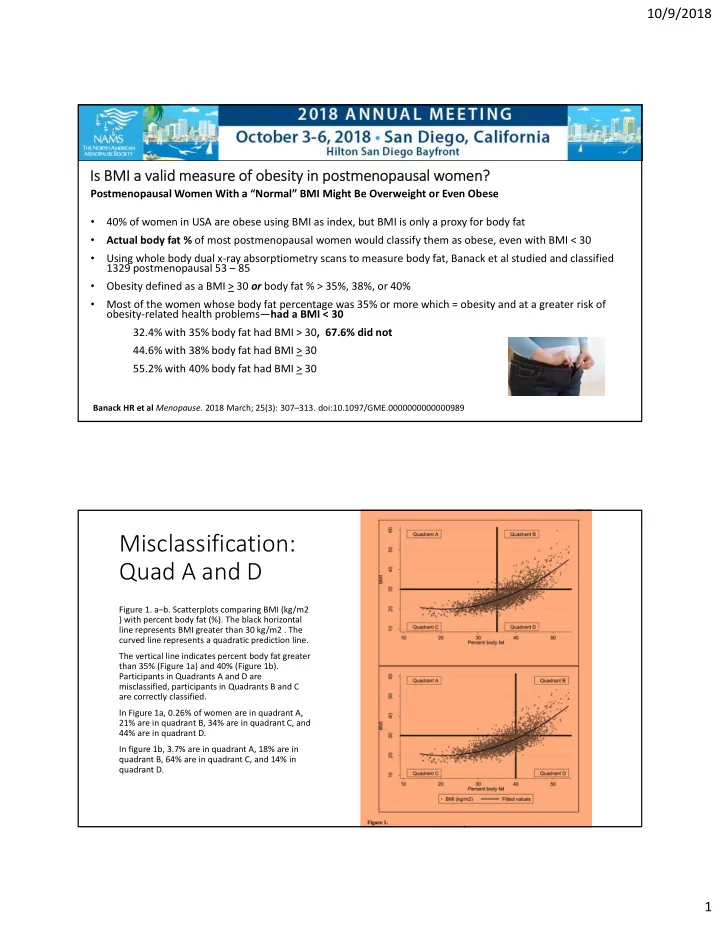
Misclassification: Quad A and D
Figure 1. a–b. Scatterplots comparing BMI (kg/m2 ) with percent body fat (%). The black horizontal line represents BMI greater than 30 kg/m2 . The curved line represents a quadratic prediction line. The vertical line indicates percent body fat greater than 35% (Figure 1a) and 40% (Figure 1b). Participants in Quadrants A and D are misclassified, participants in Quadrants B and C are correctly classified. In Figure 1a, 0.26% of women are in quadrant A, 21% are in quadrant B, 34% are in quadrant C, and 44% are in quadrant D. In figure 1b, 3.7% are in quadrant A, 18% are in quadrant B, 64% are in quadrant C, and 14% in quadrant D.