
SLIDE 1
1
Managing Capacity and Demand
- Managing dynamic demand
- Service capacity is perishable
- Yield Management
Shin‐Ming Guo NKFUST
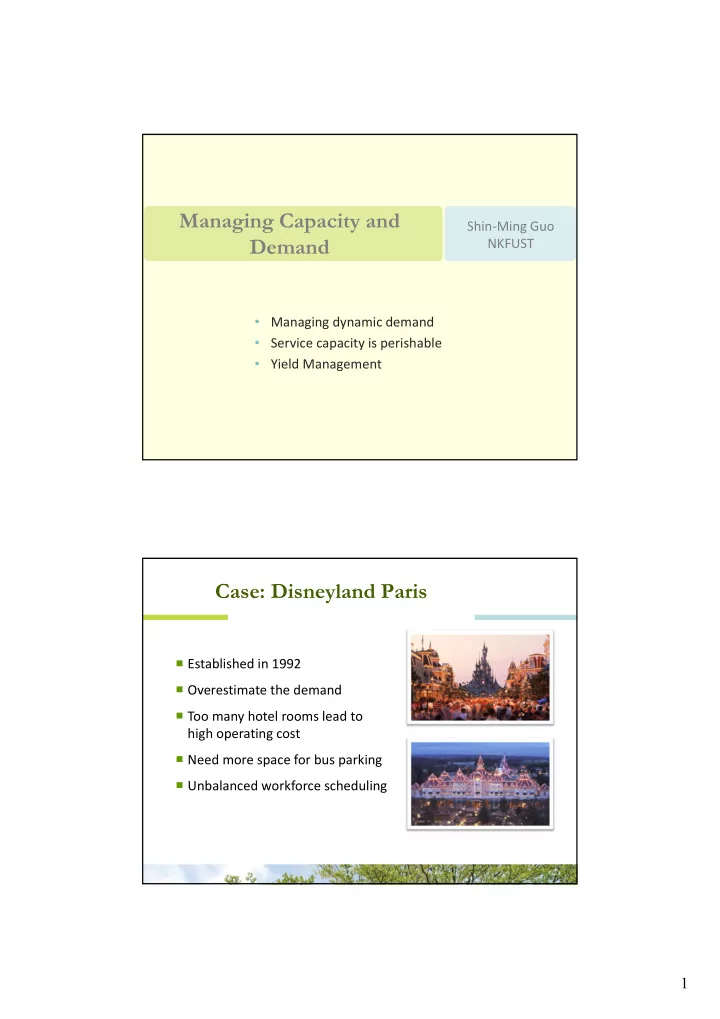
Case: Disneyland Paris
Established in 1992 Overestimate the demand Too many hotel rooms lead to
high operating cost
Need more space for bus parking Unbalanced workforce scheduling