
SLIDE 1
1
Chapter 4 Planning Capacity
Capacity Strategies Determining Capacity Requirements Supplement A & B: Decision Tools 2
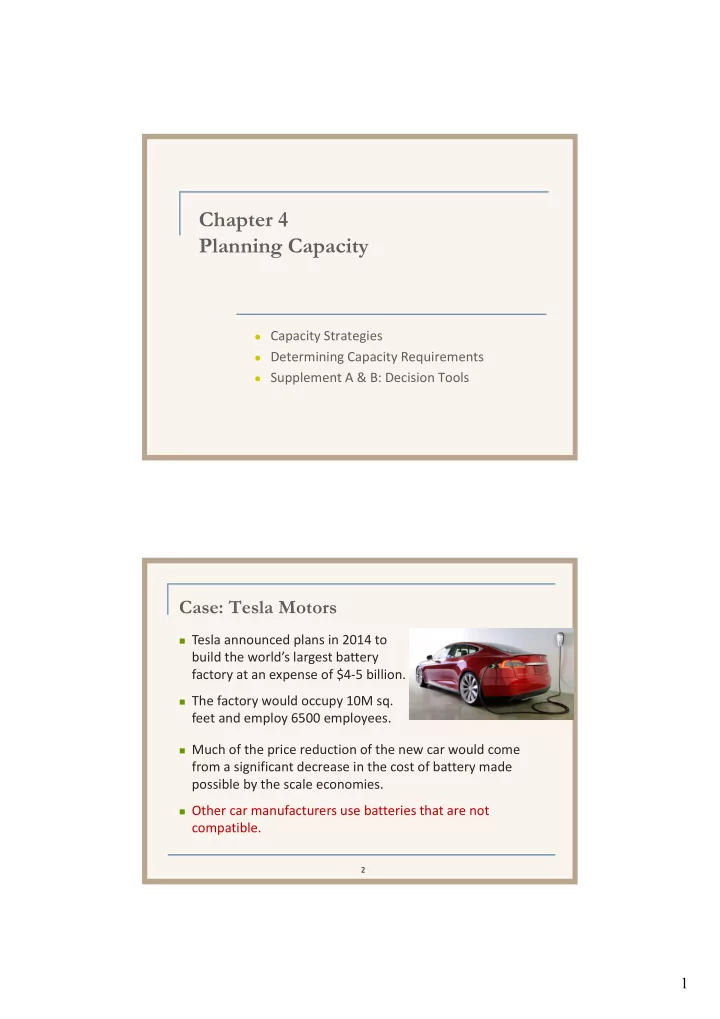
Case: Tesla Motors
Tesla announced plans in 2014 to
build the world’s largest battery factory at an expense of $4‐5 billion.
The factory would occupy 10M sq.
feet and employ 6500 employees.
Much of the price reduction of the new car would come
from a significant decrease in the cost of battery made possible by the scale economies.
Other car manufacturers use batteries that are not