
SLIDE 1
Capacity & Cost Trends Capacity & Cost Trends
18000
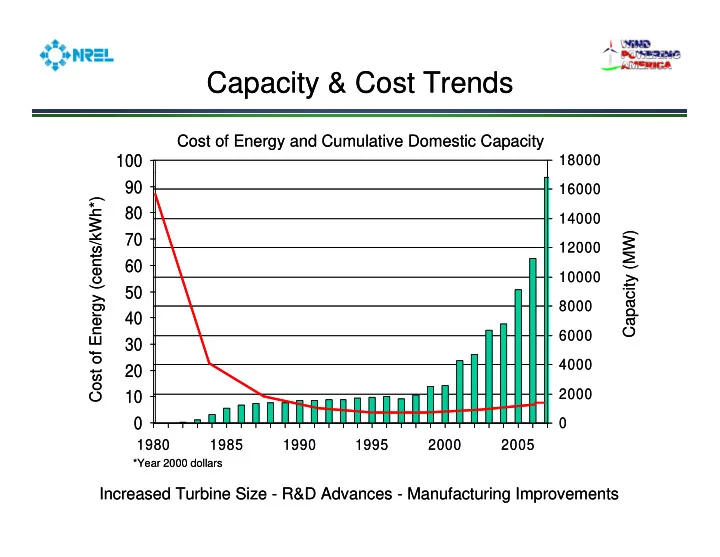
100 Cost of Energy and Cumulative Domestic Capacity
18000
100 Cost of Energy and Cumulative Domestic Capacity
12000 14000 16000
70 80 90 W) /kWh*)
12000 14000 16000
70 80 90 W) /kWh*)
8000 10000 12000
40 50 60 70 pacity (MW rgy (cents/
8000 10000 12000
40 50 60 70 pacity (MW rgy (cents/
4000 6000
20 30 40 Cap
- st of Ener
4000 6000
20 30 40 Cap
- st of Ener
2000 1980 1985 1990 1995 2000 2005
10 Co
2000 1980 1985 1990 1995 2000 2005
10 Co Increased Turbine Size - R&D Advances - Manufacturing Improvements
*Year 2000 dollars
Increased Turbine Size - R&D Advances - Manufacturing Improvements
*Year 2000 dollars