SLIDE 10 10
19
Forward link Back links
♦
Google query attributes
150M queries/day (2000/second) 100 countries 3B documents in the index
♦
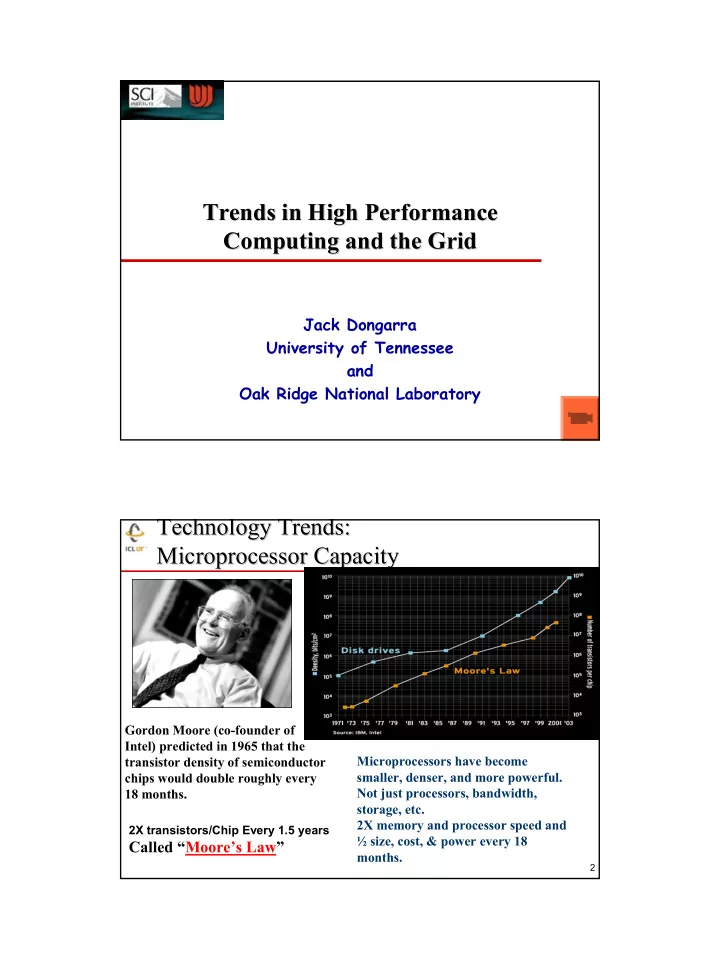
Data centers
15,000 Linux systems in 6 data centers
15 TFlop/s and 1000 TB total capability 40-80 1U/2U servers/cabinet 100 MB Ethernet switches/cabinet with gigabit Ethernet uplink
growth from 4,000 systems (June 2000)
18M queries then
♦
Performance and operation simple reissue of failed commands to new servers no performance debugging
- problems are not reproducible
Source: Monika Henzinger, Google & Cleve Moler
20
How Google Works; How Google Works; You have to think big
You have to think big
This is done “offline” … Number of inlinks to a web page is a sign of the importance of the web page
♦
Generate an incidence matrix of links to and from web pages For each web page there’s a row/column
♦
Form a transition probability matrix of the Markov chain
- Matrix is not sparse, but it is a rank one modification of a
sparse matrix ♦
Compute the eigenvector corresponding to the largest eigenvalue, which is 1.
- Solve Ax = x.
- Use the power method? (x=initial guess; iterate x Ax;)
- Each component of the vector x corresponds to a web page and
represents the weight (importance) for that web page.
- This is the basis for the “Page rank”
♦
Create an inverted index of the web;
- word : web pages that contain that word
When a query, set of words, comes in:
♦
Go to the inverted index and get the corresponding web pages for the query ♦
Rank the resulting web pages by the “Page rank” and return pointers to those page in that order.
Forward link are referred to in the rows Back links are referred to in the columns
Source: Monika Henzinger, Google & Cleve Moler
Eigenvalue problem n=3x10⁹ (see: MathWorks Cleve’s Corner)