
SLIDE 1
Is the Basin Plan on track to deliver its predicted environmental - - PowerPoint PPT Presentation
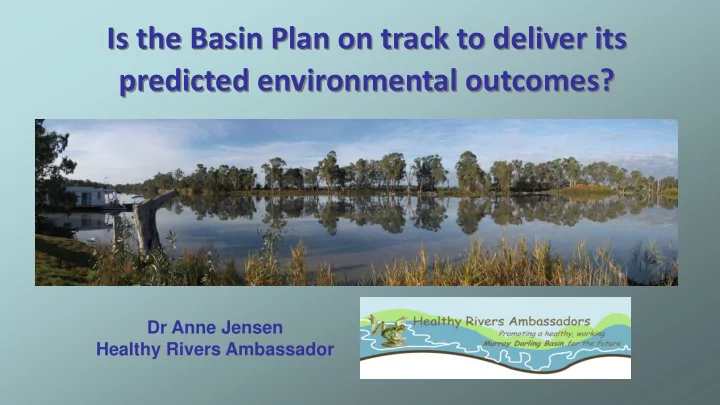
Is the Basin Plan on track to deliver its predicted environmental outcomes? Dr Anne Jensen Healthy Rivers Ambassador Basin Plan Process 2006-2012 new era of water reform (and hope!) from November 2006 recovering over-allocation of
flow targets for 4 Living Murray icon sites (need 3200 GL plus constraints fixed to deliver 17 out of 18 flow targets)
needed to maintain current degraded health
river systems to healthy state
impact of Millenium Drought 2000-2010, need extra water for recovery
& 2016 floods but declining again
E-watering site showing healthy red gum saplings and mature redgum that died in the Millenium Drought: note 2016 flood level on the trunk
ecosystems, functions & resilience, ensure coordinated management of e-water)
no loss or degradation in flows, connectivity, assets, functions, CLLMM regime, condition & recruitment
improvement in same parameters
Southern Basin, flows to Lower Lakes, Coorong & Murray Mouth, & salt export target
Source (accessed 03/04/2018): http://www.environment.gov.au/water/cewo/about
Goulburn River 278 GL of environmental delivery Lower Broken Creek 25 GL environmental delivered 20 GL return flow 321 GL return flow Hume Releases 395 GL environmental delivery 346 GL return flow
Campaspe River 28.5 GL environmental delivery Gunbower Creek 15.8 GL environmental delivery Hattah Lakes 112 GL environmental delivery 28 GL return flow 88 GL use of return flows 233 GL 329 GL Darling Flows 25 GL environmental delivery 14 GL Return flow Murrumbidgee River 228 GL environmental delivery 70 GL return flow 70 GL 14 GL
= 568 GL (CEWO) 730 GL (all e- water)
49 GL return flows 28 GL 13 GL use of return flows 12 GL use of return flows 49 GL 7 GL 2.3 GL return flow 2 GL use of return flows 3 GL use of return flows
2011 flood germinants: red gum seedlings/saplings at e-watering site vigorous growth from 2013 (~2 m left) to 2017 (~ 4 m right) Potential to gradually replace hundreds of dead mature red gums 2-500 years old (Site protected by SIS scheme)
(Porter, Kingsford & Brandis, 2016) Update 2017 survey: reduced wetland area with only 4 wetlands full, 14 partially full, 24 dry; increased total numbers to 200,000 but still well below average; breeding events much below average
Darling River fish populations in key nursery area, especially callop
valleys to create low flows in spring 2016, then increased to create food sources and nursery sites for larvae, best cod breeding event in 20 years!
to grow and migrate
and Darling fish populations able to migrate to other Basin rivers
Downstream sections of Lower Darling River dry for more than 500 days
SDLs are ‘volume of extraction that will not have negative impacts on natural environments and functions of rivers, waterways, groundwater and wetlands of the Murray-Darling Basin’
36 engineered or operational projects to deliver ‘equivalent environmental outcomes’ with less water
environmental outcomes can be achieved with less water’
individually, scored at reach scale
regulators fill gaps between floods, don’t replace natural floods:
animals
dispersal of seed and eggs
conditions
flows from different sources don’t replace flows from rivers:
management of Menindee Lakes, potential for major downstream effects on Lower Darling, impact on migration & breeding of all native fish
may reduce priority to maintain flows in ML & Lower Darling
project in SDL package for Southern Basin
projects still to be designed, subject to local consultation
accept 605 GL reduction in recovery target (& no more water acquired)
compared flow scenarios of 390 GL with 320 GL
recommended 70 GL reduction
NB targets, 22 out of 43 targets
increase NB recovery target to 410 GL
reaches & individual wetland sites, but overall ecosystem condition still stressed
95% of years without dredging, even with 3200 GL
salt exported annually
requirements, = 316-436 GL out of 605 GL
‘Without the return of enough water, our
rivers will be afflicted with more blue-green algae blooms, salinity levels will rise, more extensive areas of floodplain forests will die and internationally significant wetlands along the River Murray will be lost. Further, Indigenous communities, and pastoral and tourism industries will be badly affected.’
blooms in Southern Lagoon, although recent coordinated flows to Northern Lagoon provided feeding habitat for migratory waders at critical time
continued decline and stress in ecosystems at wider scale, need to support regeneration post-2011 flood
scale, in spite of floods 2010-12 and 2016
native fish
flows
volume available
1 2 3 4 5
Canopy Conditions Scores for Mature Black Box Trees watered (green series) vs not watered (blue series)
good as its implementation
support life cycles & processes
environmental outcomes if 605 GL reduction passed
flows
PS Basin Plan won’t include climate change effects reducing flows until 10 year review in 2022!