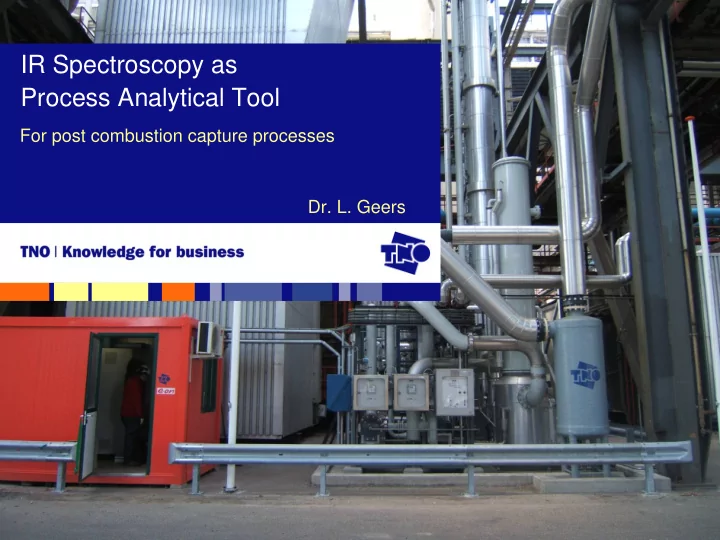

IR Spectroscopy as Process Analytical Tool For post combustion capture processes Dr. L. Geers
Introduction Post-combustion capture (PCC) The extraction of CO 2 from (power plant) flue gases • Total cost of post combustion capture is around 40 € / ton • CO 2 emission rights cost around 15 € / ton • Hence, PCC costs need to go down � process optimization 2 FTIR as PAT for PCC
Post-combustion CO 2 capture process Lean Rich Purified flue gas CO 2 solvent solvent Flue gas Heat SO 2 CO 2 CO 2 exchanger scrubber absorber desorber 3 FTIR as PAT for PCC
Efficiency compromising factors • Thermal degradation of amino acid due to heating/cooling cycles • Chemical degradation of amino acid due to formation heat stable salts • Contamination of solution with other species in flue gas • Evaporation of water from amino acid solution • Temperature fluctuations � In-line process monitoring enables process optimization and lowers operational costs 4 FTIR as PAT for PCC
Specifications of process monitoring tool Determination of concentrations of amino acid, CO 2 , and heat stable salts • in-line during processing, • with time scale < 15 min, • accurate within 10%, • prepared for speciation (near future). Weapon of choice: FTIR spectroscopy with ATR flow cell. 5 FTIR as PAT for PCC
PCC process monitoring Lean Rich Purified flue gas solvent solvent FTIR Flue gas Heat SO 2 CO 2 CO 2 exchanger scrubber absorber desorber 6 FTIR as PAT for PCC
From IR spectra to concentrations? [Amino acid] 2- ] [CO 3 ? - ] [HCO 3 [Carbamate] [Heat Stable Salts] [ ... ? ... ] • Overlapping absorption peaks of different species • Broad O-H band for water obscures peaks of other species • Chemical reactions cause peak shifting or disappearance • Temperature fluctuations affect spectra Chemometrics are necessary: Partial Least Squares Regression 7 FTIR as PAT for PCC
PLS model construction • Input data configurations • Full spectrum • Truncated spectrum � without “OH band” • Unimportant Variable Elimination pre-processing � Bad convergence of PLS model for all configurations, due to irrelevant correlations in spectra? • Pre-processing methods • Multiplicative Scatter Correction (usually for NIR) • Standard Normal Variate (usually for NIR) • Direct Orthogonal Signal Correction (or DOSC) DOSC filtering (2 compts.), PLS model (4 compts.) � R 2 =0.998 8 FTIR as PAT for PCC
Experiments Calibration + validation • 52 solutions with different concentrations of amino acid, CO 2, and SO 2 • CO 2 concentration measured with phosphoric acid method SO 2 could not be measured directly � • assumed all SO 2 absorbed by liquid • IR Spectra collected with FTIR spectrometer and ATR flow cell Testing in-line monitoring • Event identification during processing • Model robustness for unknown species Pilot plant 9 FTIR as PAT for PCC
Calibration and validation matrices (37) (15) 10 FTIR as PAT for PCC
Validation of amino acid concentration Prediction accurate within 3% Reconstructed amino acid concentration (M) Prepared amino acid concentration (M) 11 FTIR as PAT for PCC
Validation of CO 2 concentration Prediction accurate within 3% Reconstructed CO 2 concentration (M) Measured CO 2 concentration (M) 12 FTIR as PAT for PCC
Validation of amino acid concentration Prediction accurate within 1% Reconstructed SO 2 concentration (M) Prepared SO 2 concentration (M) 13 FTIR as PAT for PCC
Process event identification CO 2 + SO 2 SO 2 Reconstructed amino acid concentration (M) Water replenishment 0h 4h 10’ 8h 20’ 12h 30’ 19h 4’ 23h 14’ Time 14 FTIR as PAT for PCC
Model robustness test – CO 2 in rich stream CO 2 CO 2 + SO 2 CO 2 + SO 2 + NO x 15 FTIR as PAT for PCC
Model robustness test – SO 2 in rich stream CO 2 CO 2 + SO 2 CO 2 + SO 2 + NO x 16 FTIR as PAT for PCC
Conclusions • PLS model needs DOSC pre-processing • FTIR with PLSR able to monitor amino acid, CO 2 , and SO 2 concentrations within 3% in artificial flue gas • Events in the pilot plant experiments can be identified using the method • Model robustness is compromised at high concentrations of foreign species • Calibration needs to be done with used process solvent Next steps • Assess robustness in pilot plant with real flue gas • Incorporate temperature as a process variable • Get more detailed analysis of samples • Research stage � speciation (i.e. discern CO 3 2- , HCO 3 - , amino 2- , HSS, ...) acid, carbamate, SO 3 17 FTIR as PAT for PCC
Contact information Dr. L. Geers – Senior research scientist process intensification +31 (0)15 26 92 384, leon.geers@tno.nl Dr. A. van de Runstraat – System engineer CO 2 capture +31 (0)15 26 92 886, annemieke.vanderunstraat@tno.nl Dr. E. Goetheer – Technology manager CO 2 capture +31 (0)15 26 92 846, earl.goetheer@tno.nl 18 FTIR as PAT for PCC
Recommend
More recommend