
SLIDE 1
CHEM 344 – IR Spectroscopy
CHEM 344 IR Spectroscopy 12.2 Physical Basis for IR Spectroscopy I - - PowerPoint PPT Presentation
CHEM 344 IR Spectroscopy 12.2 Physical Basis for IR Spectroscopy I nf r ared ( IR ) spectroscopy can be used to determine functional groups and bond strengths based upon molecular vibrations. Chemical bonds are not rigid, but in continuous
CHEM 344 – IR Spectroscopy
Physical Basis for IR Spectroscopy
2
Infrared (IR) spectroscopy can be used to determine functional groups and bond strengths based upon molecular vibrations. Chemical bonds are not rigid, but in continuous states of vibration. If you hit a molecule with a frequency
vibration, an absorption occurs and that vibrational state is excited. Normal modes of vibration of water 3585 cm-1 3506 cm-1 1885 cm-1
12.2
Factors that Affect Frequency
3
𝜉 = 1 2𝜌 𝑙 𝑛1 + 𝑛2 𝑛1𝑛2 If chemical bonds are roughly springs, then the vibrational energy is governed by Hooke’s Law. The frequency is dependent on the force constant (~ bond strength) and the masses of the nuclei.
Bond Approximate vibrational frequency Approximate bond length C–C 1000 cm-1 1.54 Å C=C 1600 cm-1 1.33 Å C≡C 2200 cm-1 1.20 Å Bond Approximate vibrational frequency C(sp)–H 3300 cm-1 C(sp2)–H 3100 cm-1 C(sp3)–H 2900 cm-1 12.3 Bond Approximate vibrational frequency C(sp3)–D 2200 cm-1 C(sp3)–H 2900 cm-1
IR Spectrum of Butanone
4
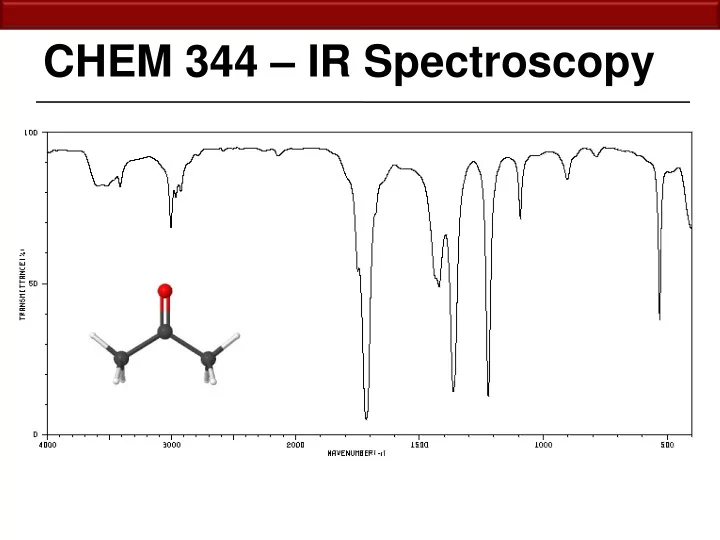
Vertical axis in %Transmittance (most often) for liquid phase IR. Horizontal axis in wavenumber (cm-1) for most IR Absorptions are observed as sharp or broad reductions in the % of light transmitted through the sample. absorptions No significant absorption
12.4
No significant absorption
IR Spectrum of Butanone
5
O–H, N–H, C–H stretches C≡N, C≡C stretches C=O, C=N, C=C stretches C–O, C–N, C–C stretches and various bends C–H bends and other low energy vibrations Great for identifying carbonyl-containing functional groups
12.4
IR Spectrum of Heptane
6
This is a pretty boring IR spectrum due to the lack of functional groups in an alkane. C–H stretches This region is usually too complicated for interpretation at our level. (You can mostly ignore it.)
12.4
IR of 1-Heptene vs. Heptane
7
Heptane 1-Heptene C(sp2)-H C(sp3)-H
12.4
IR Spectrum of 3-buten-1-ol
8
Broad and intense signals in this region are diagnostic for H-atoms connected to N or O atoms that are involved in hydrogen bonding.
12.4
C=C stretch
Three Isomeric Hexynes
9
weak C≡C stretch IR intensity depends on the change in dipole during the vibration. 1-Hexyne 2-Hexyne 3-Hexyne
12.4
Functional Group Identification
10
Rarely are complete structure determinations made solely with IR spectroscopy. Usually IR provides conformation of the presence of a known molecule or a partial structure determination when used in tandem with other analyses. Usually very useful Usually complicated and less useful
presence or absence of hydrogen-bonding.
difference between different double bonded molecules and even different carbonyl functional groups.
12.3
Functional Group Identification
11
O O
1743 cm-1 1715 cm-1
O O N
1646 cm-1
21.4
IR Spectroscopy Practice
12
12.1 – 12.5
Fingerprint region No C=O or C=C stretch C≡C or C≡N stretch No O–H or N–H stretch propionitrile
Assigned IR spectrum – CON6
13
syn-syn CON6 syn-anti CON6
IR Spectroscopy in Photochemistry
14
N2
hν
How to determine which product is formed?
establishes the identity of the product.
IR Spectroscopy in Photochemistry
Frequency (cm-1)
500 1000 1500 2000
∆ Absorbance
0.0 0.1 0.2 0.3
λ > 237 nm, 40 min (Ar, 10 K) (B3LYP/6-31G*) (B3LYP/6-31G*) Experimental
N2
15
Product Reactant
IR Spectroscopy Practice
16
12.1 – 12.5
C=C stretches Fingerprint region No C=O stretch No C≡C or C≡N stretch No O–H or N–H stretch anisole
IR Spectroscopy Practice
17
12.1 – 12.5
Fingerprint region No C=O or C=C stretch No C≡C or C≡N stretch No O–H or N–H stretch 2,3-dimethyl-2-butene
IR Spectroscopy – Summary
18
12.1 – 12.5
Infrared (IR) spectroscopy can be used to determine functional groups and bond strengths based upon molecular vibrations. Frequency of the IR absorptions is dependent upon the bond strengths and the masses of the atoms in the molecule. IR intensity is related to a change in dipole upon vibration. IR spectra can be used to easily identify functional groups.
Much of the spectra can be ignored at the Chem 344/345 level, but can be assigned with a deeper analysis using computational chemistry.
HOW TO SURVIVE THE ORGANIC LAB
Organic Chemistry Laboratory Spring 2013
Emailing your TA, Nick Hill, or Brian Esselman is a great idea.
what you are thinking, what you’ve tried to do to solve your problem and/or what reasoning you’ve done.
answer is easily obtainable (With 800+ students we can’t answer individual questions for everyone, that’s why we made the lab manual and handouts.
Get Help! (But, do it smartly and kindly.)
Plan ahead
Don’t wait until 10 min before lab begins to read the procedure or write your pre-lab.
Understand what you need to do in lab
Is it a 2-day lab? Do I need to reflux the reaction? Come prepared.
Think about what you are doing in lab while you are doing it!
Why do you need to reflux/cool/add acid/add base/extract/distill?
Advice for success in CHEM 344
Know exactly what you need to do for the lab report
Typically NMR and/or GC-MS, post-lab questions (including computational modeling).
Plan ahead (again)
Know when each lab report is due (its printed in the lab manual) Look at the spectra and questions at least 24 hrs before report is due