?
"@
Understanding Cellular Systems Using Genome Data
Kim Reynolds, UT Southwestern, Sept. 2014 Why is this problem hard?
- Detailed knowledge of the molecular players…
an apparently dense, interconnected network.
? "@ Kim Reynolds, UT Southwestern, Sept. 2014 Why is this - - PowerPoint PPT Presentation
Understanding Cellular Systems Using Genome Data ? "@ Kim Reynolds, UT Southwestern, Sept. 2014 Why is this problem hard? Detailed knowledge of the molecular players an apparently dense, interconnected network. Why is
"@
Kim Reynolds, UT Southwestern, Sept. 2014 Why is this problem hard?
an apparently dense, interconnected network.
Why is this problem hard?
an apparently dense, interconnected network.
what do we mean by complex?
Hillenmeyer, ME et al. (2008) Science 320, p 5874
gene essentiality in yeast for ~5000 homozygous gene deletion strains.
First of all, not all genes are equally important.
Secondly, the effect of multiple genes can’t be predicted from the effect of genes taken individually (things don’t add)
An example - synthetic lethality: Why is this problem hard?
an apparently dense, interconnected network.
These two features: (1) heterogeneity in functional importance (some things more important than others) (2) non-additive (cooperative) interactions between components
Fujii, T et al. (2009) Structure 17, p. 1425 Berg, HC (2003) Ann Rev Biochem 72, p 19
As an example, let’s consider the bacterial flagellum.
motAB fliAZY fliBAE fliE fliFGHIJK fliLMNOPQR flgBCDEFGHIJKL
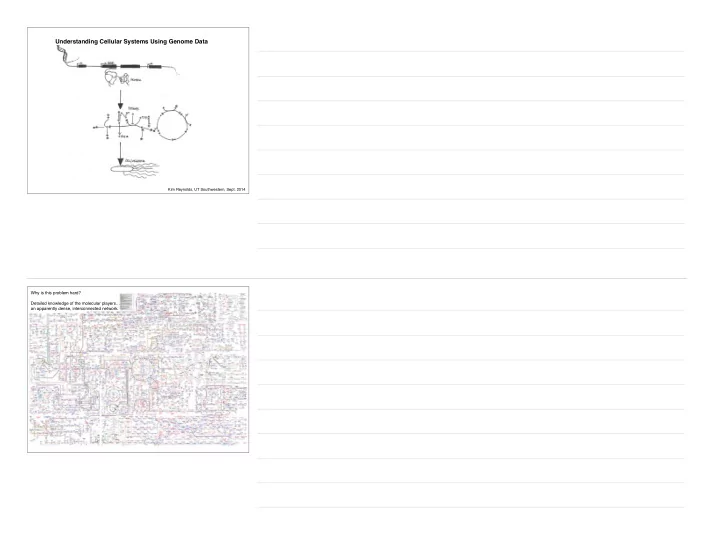
Proteins Cellular System
typhimurium Fujii, T et al. (2009) Structure 17, p. 1425 Berg, HC (2003) Ann Rev Biochem 72, p 19
Genes As an example, let’s consider the bacterial flagellum. A multi-protein complex often described by analogy to man-made machines with words like “motor”, “stator”, “rotor”, etc...
components necessary for function.
systems are encoded by the genome, work and evolve.
Evolution has arrived at a degeneracy of solutions to the problem of bacterial motility!
peripheral elements are more variable. This hints that a simpler representation of such systems may be possible.
Chen et al. (2011) EMBO J 30 p. 2972
The central idea: Comparison of genomes across many species can be used to make a statistical model for the design of biological systems.
What do I mean here? Let’s look at an example….
Here is one protein: N-GEEDIPREPRRIVIHRGSTGLGFNIVGGEDGEGIFISFILAG-GPADLSGELRKGDQILSVNGVDLRNASHEQAAIALKNAGQTVTIIAQYKPEE-C
Amino acid sequence (primary structure): Secondary structure: Three dimensional structure:
We can collect many amino acid sequences that encode this protein in different species, and align them to each other - a multiple sequence alignment
DIHAICACCKVRGIGNKGVL FLHAVVAVCPPQGIGKGGSL IISMIAAMADNRVIGKDNQM MISMIAAMAHDRVIGLDNQM LISLIAALAHNNLIGKDNLI IISMIAAMAKQRIIGKDNQM —MIAAMANNRVIGLDNKMPW VLNAIVAVCPDLGIGRNGDL
. . . . . . . . .
1 12 18
. . . . . . . . . . . . . . . . . . . . . . . .
VIYKRK EVYEKI TILEKQ ETWQRR VTLSRQ VILERV VTLYKY VYES— 156 1 2 418 4 3 417 416 5
Now we’d like to analyze this alignment to measure two things:
k Conservation as a measure of functional importance
Lockless and Ranganathan, Science 286, p.295
k i
What we want to measure: Are the amino acid frequencies at a particular position in the alignment more conserved than random?
Cell (2009) 138: 774-86.
j k
mean
k i j
random 0.6 H 0.4 V 0.7 F 0.3 L H H H H H H V V V V L I V Q W V M S A E F F F F F F F L L L
k Conservation as a measure of functional importance
Lockless and Ranganathan, Science 286, p.295
k i
What we want to measure: Are the amino acid frequencies at a particular position in the alignment more conserved than random?
Cell (2009) 138: 774-86.
How we calculate this:
j k
mean
k i j
random 0.6 H 0.4 V 0.7 F 0.3 L H H H H H H V V V V L I V Q W V M S A E F F F F F F F L L L
kk j i Coevolution as a measure of interaction between two positions.
The basic premise: Functional Coupling of two amino acid positions will result in co-evolution... provided that the interaction contributes to the fitness of the protein.
Lockless and Ranganathan, Science 286, p.295
Cell (2009) 138: 774-86.
k
mean
k i j
random 0.6 H 0.4 V 0.7 F 0.3 L H H H H H H V V V V L I V Q W V M S A E F F F F F F F L L L
kk j i
An example: Coevolution as a measure of interaction between two positions.
k
mean
k i j
random 0.6 H 0.4 V 0.7 F 0.3 L H H H H H H V V V V L I V Q W V M S A E F F F F F F F L L L
j i
j
j
kk j i What we want to measure: How independent are the amino acid frequencies at sites i and j? Coevolution as a measure of interaction between two positions. k
mean
k i j
random 0.6 H 0.4 V 0.7 F 0.3 L H H H H H H V V V V L I V Q W V M S A E F F F F F F F L L L
kk j i
What we want to measure: How independent are the amino acid frequencies at sites i and j? How we calculate this: Coevolution as a measure of interaction between two positions.
k
mean
k i j
random 0.6 H 0.4 V 0.7 F 0.3 L H H H H H H V V V V L I V Q W V M S A E F F F F F F F L L L
322 372 A global view of coupling between amino acids, based on evolution.
a pair of amino acids.
From initial inspection we can see that the matrix is: (1) sparse (2) shows no obvious arrangement in primary structure.
Lockless and Ranganathan (1999) Science 286, p.295
What does the pattern of couplings look like on the structure? Let’s take one position to start...
H372 Lockless and Ranganathan (1999) Science 286, p.295
For a single position, we can examine all other coupled residues... The global architecture of correlations... A map of interactions between H372 and the remainder of the PDZ domain.
H372
Cell (2009) 138: 774-86.
Mapping all the coupled positions to the structure, we see that they form a physically contiguous network… the protein sector. So this is for one protein… what about multiple proteins?
active site ( j ) allosteric site ( i )
B β α γ δ δ B C D E B
i j
B
i j
C D E
i j
B C D E B C D E
These co-evolving units seem to be “wired up” in larger cellular systems: fliG fliM fliN Flagellar Motor:
Neal Sharma
Torque-generation ring:
Minamino et al. (2008). Curr. Op. Struct Biol., 18, 693-701 Vartanian et al. (2012). JBC, 287, 35779-35783
Sector mapping:
evolve.
Acknowledgements Olivier Rivoire (CNRS, Grenoble) Ivan Junier (CRG, Barcelona) Collaborators http://systems.swmed.edu/krlab/Reynolds_Lab.html UT Southwestern Green Center for Systems Biology Chris Ingle Neal Sharma Andrew Schober Funds