introduction to ilwis 3 using a data set from northen
play

Introduction to ILWIS 3 using a data set from Northen Pakistan. - PDF document

Introduction to ILWIS 3 using data from Pakistan Introduction to ILWIS 3 using a data set from Northen Pakistan. Summary & background The exercises in this chapter are modified from the ILWIS Users Guide, by substituting the original data


  1. Introduction to ILWIS 3 using data from Pakistan Introduction to ILWIS 3 using a data set from Northen Pakistan. Summary & background The exercises in this chapter are modified from the ILWIS Users Guide, by substituting the original data with data from Pakistan. − These exercises are intended to bring all participants to a common level, and allow them to have a basic understanding of the functionalities of ILWIS 3. Available data for the exercise 
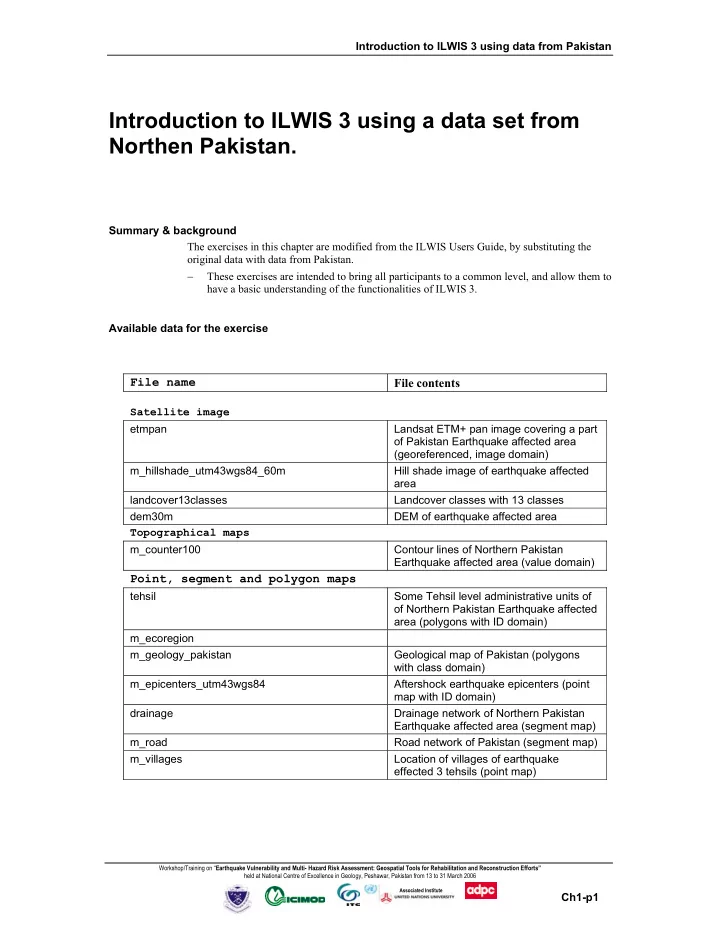
File name File contents Satellite image etmpan Landsat ETM+ pan image covering a part of Pakistan Earthquake affected area (georeferenced, image domain) m_hillshade_utm43wgs84_60m Hill shade image of earthquake affected area landcover13classes Landcover classes with 13 classes dem30m DEM of earthquake affected area Topographical maps m_counter100 Contour lines of Northern Pakistan Earthquake affected area (value domain) Point, segment and polygon maps tehsil Some Tehsil level administrative units of of Northern Pakistan Earthquake affected area (polygons with ID domain) m_ecoregion m_geology_pakistan Geological map of Pakistan (polygons with class domain) m_epicenters_utm43wgs84 Aftershock earthquake epicenters (point map with ID domain) drainage Drainage network of Northern Pakistan Earthquake affected area (segment map) m_road Road network of Pakistan (segment map) m_villages Location of villages of earthquake effected 3 tehsils (point map) Workshop/Training on “ Earthquake Vulnerability and Multi- Hazard Risk Assessment: Geospatial Tools for Rehabilitation and Reconstruction Efforts” held at National Centre of Excellence in Geology, Peshawar, Pakistan from 13 to 31 March 2006 Associated Institute Ch1-p1

  2. Introduction to ILWIS 3 using data from Pakistan Chapter 1 Introduction to ILWIS 3 Using data from Pakistan ILWIS is an acronym for the Integrated Land and Water Information System . It is a Geographic Information System ( GIS ) with Image Processing capabilities. ILWIS has been developed by the International Institute for Geo-Information Science and Earth Observation (ITC), Enschede, The Netherlands. As a GIS package, ILWIS allows you to input, manage, analyze and present geo-graphical data. From the data you can generate information on the spatial and temporal patterns and processes on the earth surface. Geographic Information Systems are nowadays indispensable in many different fields of applications to assist in the decision making process. Most decisions are influenced by some facts of geography. What is at a certain location? Where are the most suitable sites? Where, when and which changes took place? Here are some examples. − In land use planning, GIS is used to evaluate the consequences of different scenarios in the development of a region. − In geology, GIS is used to find the most suitable places for mining, or to determine areas subject to natural hazards. − Areas that may be affected by pollution are analyzed using GIS functions. − Extensions of cities are planned, based on analysis of many spatial and temporal patterns, etc. In order to be able to make the right decisions, access to different sorts of information is required. The data should be maintained and updated and should be used in the analysis to obtain useful information. In this process ILWIS can be an important tool. This Lesson is intended to introduce you to ILWIS, and specifically to the user interface. You will learn how to start ILWIS, the functions of the Main window and how to open maps and tables, using spatial and attribute data from Pakistan. Workshop/Training on “ Earthquake Vulnerability and Multi- Hazard Risk Assessment: Geospatial Tools for Rehabilitation and Reconstruction Efforts” held at National Centre of Excellence in Geology, Peshawar, Pakistan from 13 to 31 March 2006 Associated Institute Ch1-p2

  3. Introduction to ILWIS 3 using data from Pakistan 1.1 Starting ILWIS To start ILWIS, double-click the ILWIS icon on the desktop. After the opening screen you see the ILWIS Main window (see Figure 1.1.1.1). From this window you can manage your data and start all operations. Close button Object selection toolbar Maximize button Standard toolbar Minimize button Control menu icon Menu bar Title bar Command line Operations/Navigator pane Status bar Scroll bar Catalog Figure 1.1.1: The ILWIS Main window The ILWIS Main window consists (by default) of a Title bar , a Menu bar , a Standard toolbar , an Object selection toolbar , a Command line , a Catalog , a Status bar and an Operations/Navigator pane with an Operation-tree , an Operation-list and a Navigator . There is a possibility that the right-central part (i.e. the Catalog ) of the Main window on your screen does not look exactly the same as shown in Figure 1.1.1. This may be due to the fact that you have another system configuration and/or that during the installation of ILWIS you decided to copy the data files to a different directory than the standard start-up directory C:\ILWIS3 Data\Example Data . 1.1.1 The Navigator Before continuing with the exercises you first need to change to the subdirectory \EVMHRAGTRRE\Chapter1 , where the data files for this chapter are stored. You can use the Navigator (Figure 1.1.2) to change the current drive and working directory. Workshop/Training on “ Earthquake Vulnerability and Multi- Hazard Risk Assessment: Geospatial Tools for Rehabilitation and Reconstruction Efforts” held at National Centre of Excellence in Geology, Peshawar, Pakistan from 13 to 31 March 2006 Associated Institute Ch1-p3

  4. Introduction to ILWIS 3 using data from Pakistan Figure 1.1.2: The ILWIS Navigator. � • Click the word Navigator in the Operations/Navigator pane. The Navigator lists all drives and directories (i.e. folders) in a tree structure. The Navigator also has a History to easily return to previously visited drives and directories. � • Click on the drives and folders in the Navigator until you are in the directory where the data for this exercise has been stored. The data is located in the directory \ EVMHRAGTRRE \Chapter1. 1.1.2 Catalog If you are in the correct directory \ EVMHRAGTRRE \Chapter1 you will see, that the right hand side of the Main window, looks the same as Figure 1.1.3. This part of the Main window, in which maps, tables and other ILWIS objects in the working directory are displayed each with its own type of icon, is called the Catalog . When you double-click an object in the Catalog, it will be displayed. Figure 1.1.3: Example of a Catalog of the ILWIS Main window. Workshop/Training on “ Earthquake Vulnerability and Multi- Hazard Risk Assessment: Geospatial Tools for Rehabilitation and Reconstruction Efforts” held at National Centre of Excellence in Geology, Peshawar, Pakistan from 13 to 31 March 2006 Associated Institute Ch1-p4

  5. Introduction to ILWIS 3 using data from Pakistan Among others, the following objects can be seen, of which most of them are related to the northern Pakistan: utm43wgs84 A coordinate system , containing the definition of the coordinate system (the minimum and maximum coordinates of the study area and the optionally map projection) used for the maps of the Pakistan area; m_geology_pakistan A domain , listing names of the m_geology_pakistan; m_geology_pakistan A polygon map containing information on m_geology_pakistan; m_geology_pakistan A representation , containing the color assignments of the mapping units in the geological map; tehsil An attribute table containing information on the administrative units; etmpan A raster map , containing a band of a satellite image. ! For a complete list of ILWIS objects and their icons, see the summary of section 1.1 or the ILWIS Help topic Basic concepts , ILWIS objects and icons . Customizing the Catalog To show only maps and tables in the Catalog : � • Click the Customize Catalog button in the Standard toolbar (Figures 1.1.1 and 1.1.8) of the Main window. The Customize Catalog sheet is opened. The object Selection tab contains a list box in which the object types that are shown in the Catalog appear highlighted. You see that all ILWIS objects are selected. To show only the map and table objects, i.e. the objects with the icons , , , and : � • Select on the object Selection tab the first object type (i.e. the Raster map), keep the left mouse button pressed and move the mouse pointer to the last object you want to select (i.e. the Table ). • Release the mouse button and click OK . You will see that the Catalog has changed and that now only the map and table objects are shown in the current Catalog . The ILWIS Main window may show more than one Catalog . You can thus keep your data organized in different directories. Workshop/Training on “ Earthquake Vulnerability and Multi- Hazard Risk Assessment: Geospatial Tools for Rehabilitation and Reconstruction Efforts” held at National Centre of Excellence in Geology, Peshawar, Pakistan from 13 to 31 March 2006 Associated Institute Ch1-p5

Download Presentation
Download Policy: The content available on the website is offered to you 'AS IS' for your personal information and use only. It cannot be commercialized, licensed, or distributed on other websites without prior consent from the author. To download a presentation, simply click this link. If you encounter any difficulties during the download process, it's possible that the publisher has removed the file from their server.

Recommend


More recommend