
SLIDE 1
Data Visualization Jeffrey Heer Stanford University Set A Set B - - PowerPoint PPT Presentation
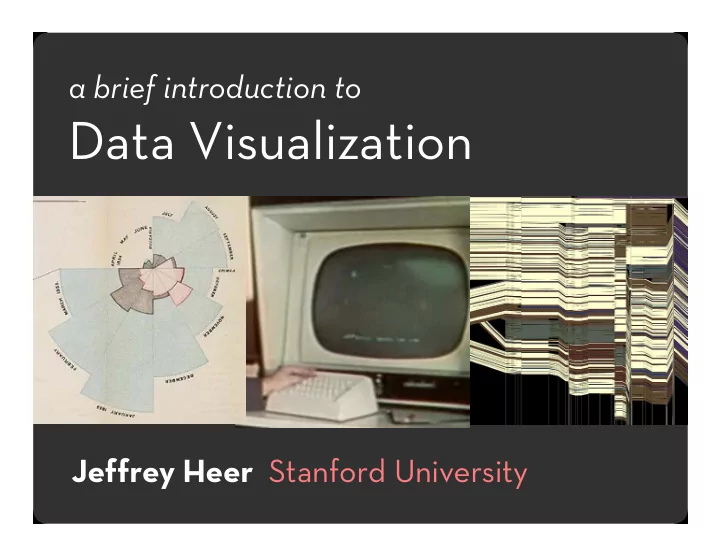
a brief introduction to Data Visualization Jeffrey Heer Stanford University Set A Set B Set C Set D X Y X Y X Y X Y 10 8.04 10 9.14 10 7.46 8 6.58 8 6.95 8 8.14 8 6.77 8 5.76 13 7.58 13 8.74 13 12.74 8 7.71 9
Set A Set B Set C Set D
X Y X Y X Y X Y 10 8.04 10 9.14 10 7.46 8 6.58 8 6.95 8 8.14 8 6.77 8 5.76 13 7.58 13 8.74 13 12.74 8 7.71 9 8.81 9 8.77 9 7.11 8 8.84 11 8.33 11 9.26 11 7.81 8 8.47 14 9.96 14 8.1 14 8.84 8 7.04 6 7.24 6 6.13 6 6.08 8 5.25 4 4.26 4 3.1 4 5.39 19 12.5 12 10.84 12 9.11 12 8.15 8 5.56 7 4.82 7 7.26 7 6.42 8 7.91 5 5.68 5 4.74 5 5.73 8 6.89
[Anscombe 73] Summary Statistics Linear Regression uX = 9.0 σX = 3.317 Y2 = 3 + 0.5 X uY = 7.5 σY = 2.03 R2 = 0.67
2 4 6 8 10 12 14 5 10 15 2 4 6 8 10 12 14 5 10 15 2 4 6 8 10 12 14 5 10 15 2 4 6 8 10 12 14 5 10 15 20
Set A Set C Set D Set B
X X Y Y
1826(?) Illiteracy in France, Pierre Charles Dupin
cabspotting.org
Wikipedia History Flow (IBM)
Wikipedia History Flow (IBM)
Record: store information
Galileo’s drawings of the phases of the moon from 1616 http://galileo.rice.edu/sci/observations/moon.html
Gallop, Bay Horse “Daisy” [Muybridge 1884-86]
Record: store information
Analyze: support reasoning about information
In 1854 John Snow plotted the position of each cholera case on a map. [from Tufte 83]
Used map to hypothesize that pump on Broad St. was the cause. [from Tufte 83]
Record: store information
Analyze: support reasoning about information
Communicate: convey information to others
1856 “Coxcomb” of Crimean War Deaths, Florence Nightingale
Which is brighter?
Which is brighter?
(128, 128, 128) (144, 144, 144)
Which is brighter?
Which is brighter?
(134, 134, 134) (128, 128, 128)
Many continuous variations are perceived in discrete steps
Sizes standardized in 16th century
a
a
a
a
a
a a a a a a a a a a a
6 7 8 9 10 11 12 14 16 18 21 24 36 48 60 72
Value is perceived as ordered
Encode ordered values Encode continuous variables [but not as well]
Hue is normally perceived as unordered
Encode categories using color
Compare area of circles
Compare length of bars
Most accurate Position Length Slope Angle Area Volume Least accurate Color hue-saturation-density
x-axis position: year y-axis position: currency color: imports/exports ratio
http://www.smartmoney.com/marketmap/
rectangle area: market capitalization rectangle position: market sector, market cap color hue: loss vs. gain color value: magnitude of loss or gain
y-axis: temperature x-axis: longitude / time
temperature over space/time
y-axis: longitude x-axis: latitude width: army size
army position (lat/lon) and army size (width)
longitude latitude army size temperature latitude / time
Depicts at least 5 quantitative variables. Any others?