
SLIDE 1
1
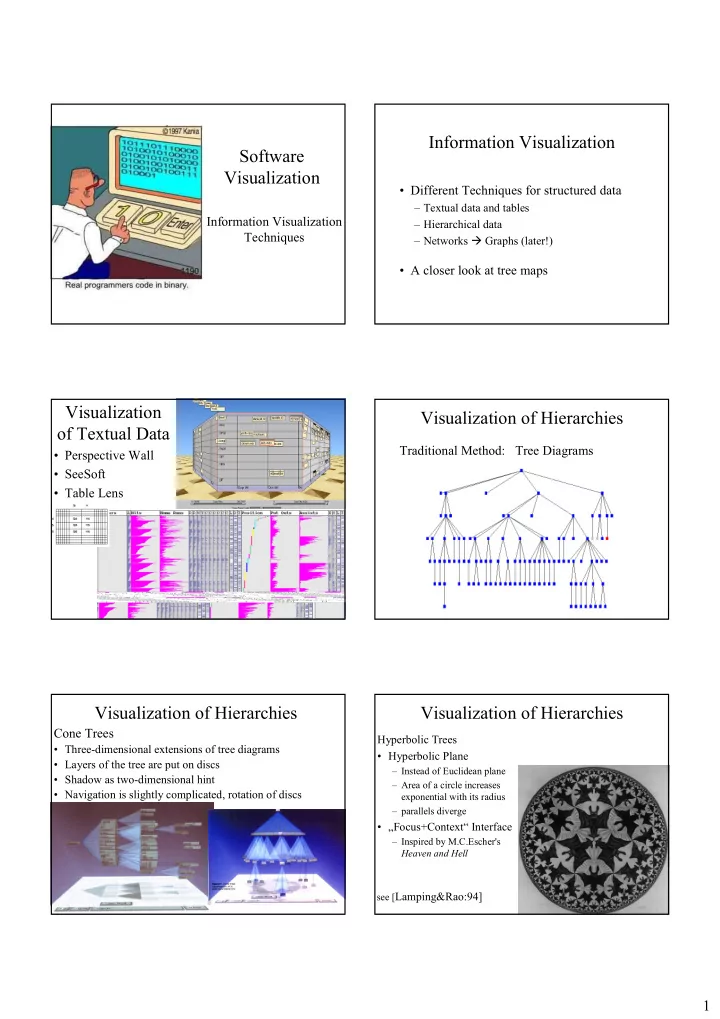
Software Visualization
Information Visualization Techniques
Information Visualization
- Different Techniques for structured data
– Textual data and tables – Hierarchical data – Networks Graphs (later!)
- A closer look at tree maps
Visualization
- f Textual Data
- Perspective Wall
- SeeSoft
- Table Lens
Visualization of Hierarchies
Traditional Method: Tree Diagrams Cone Trees
- Three-dimensional extensions of tree diagrams
- Layers of the tree are put on discs
- Shadow as two-dimensional hint
- Navigation is slightly complicated, rotation of discs
Visualization of Hierarchies Visualization of Hierarchies
Hyperbolic Trees
- Hyperbolic Plane
– Instead of Euclidean plane – Area of a circle increases exponential with its radius – parallels diverge
- „Focus+Context“ Interface