
http://www.cs.ubc.ca/~tmm/courses/436V-20
Information Visualization Data Abstraction
Tamara Munzner Department of Computer Science University of British Columbia
Lect 2, 9 Jan 2020
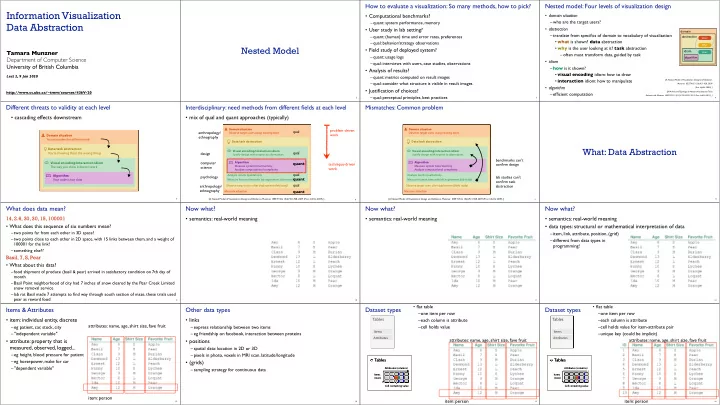
Nested Model
2
How to evaluate a visualization: So many methods, how to pick?
- Computational benchmarks?
– quant: system performance, memory
- User study in lab setting?
– quant: (human) time and error rates, preferences – qual: behavior/strategy observations
- Field study of deployed system?
– quant: usage logs – qual: interviews with users, case studies, observations
- Analysis of results?
– quant: metrics computed on result images – qual: consider what structure is visible in result images
- Justification of choices?
– qual: perceptual principles, best practices
3
Nested model: Four levels of visualization design
- domain situation
– who are the target users?
- abstraction
– translate from specifics of domain to vocabulary of visualization
- what is shown? data abstraction
- why is the user looking at it? task abstraction
– often must transform data, guided by task
- idiom
– how is it shown?
- visual encoding idiom: how to draw
- interaction idiom: how to manipulate
- algorithm
– efficient computation
4 [A Nested Model of Visualization Design and Validation.
- Munzner. IEEE
TVCG 15(6):921-928, 2009 (Proc. InfoVis 2009). ]
algorithm idiom abstraction domain
[A Multi-Level Typology of Abstract Visualization Tasks Brehmer and Munzner. IEEE TVCG 19(12):2376-2385, 2013 (Proc. InfoVis 2013). ]
Different threats to validity at each level
- cascading effects downstream
5
Domain situation You misunderstood their needs You’re showing them the wrong thing Visual encoding/interaction idiom The way you show it doesn’t work Algorithm Your code is too slow Data/task abstraction
6
Interdisciplinary: need methods from different fields at each level
Domain situation Observe target users using existing tools Visual encoding/interaction idiom Justify design with respect to alternatives Algorithm Measure system time/memory Analyze computational complexity Observe target users after deployment ( ) Measure adoption Analyze results qualitatively Measure human time with lab experiment (lab study) Data/task abstraction
computer science design psychology anthropology/ ethnography anthropology/ ethnography problem-driven work technique-driven work
[A Nested Model of Visualization Design and
- Validation. Munzner. IEEE TVCG 15(6):921-928, 2009 (Proc. InfoVis 2009). ]
- mix of qual and quant approaches (typically)
qual qual qual qual quant quant quant
7
Mismatches: Common problem
Domain situation Observe target users using existing tools Visual encoding/interaction idiom Justify design with respect to alternatives Algorithm Measure system time/memory Analyze computational complexity Observe target users after deployment ( ) Measure adoption Analyze results qualitatively Measure human time with lab experiment (lab study) Data/task abstraction
[A Nested Model of Visualization Design and
- Validation. Munzner. IEEE TVCG 15(6):921-928, 2009 (Proc. InfoVis 2009). ]
lab studies can't confirm task abstraction benchmarks can't confirm design
What: Data Abstraction
8
What does data mean?
14, 2.6, 30, 30, 15, 100001
- What does this sequence of six numbers mean?
– two points far from each other in 3D space? – two points close to each other in 2D space, with 15 links between them, and a weight of 100001 for the link? – something else??
Basil, 7, S, Pear
- What about this data?
– food shipment of produce (basil & pear) arrived in satisfactory condition on 7th day of month – Basil Point neighborhood of city had 7 inches of snow cleared by the Pear Creek Limited snow removal service – lab rat Basil made 7 attempts to find way through south section of maze, these trials used pear as reward food
9
Now what?
- semantics: real-world meaning
10
Now what?
- semantics: real-world meaning
11
Now what?
- semantics: real-world meaning
- data types: structural or mathematical interpretation of data
–item, link, attribute, position, (grid) –different from data types in programming!
12
Items & Attributes
- item: individual entity, discrete
–eg patient, car, stock, city –"independent variable"
- attribute: property that is
measured, observed, logged...
–eg height, blood pressure for patient –eg horsepower, make for car –"dependent variable"
13
item: person attributes: name, age, shirt size, fave fruit
Other data types
- links
–express relationship between two items –eg friendship on facebook, interaction between proteins
- positions
–spatial data: location in 2D or 3D –pixels in photo, voxels in MRI scan, latitude/longitude
- (grids)
–sampling strategy for continuous data
14
Dataset types
15
Tables
Attributes (columns) Items (rows) Cell containing value
Tables
Items Attributes
item: person attributes: name, age, shirt size, fave fruit
- flat table
–one item per row –each column is attribute –cell holds value
Dataset types
- flat table
–one item per row –each column is attribute –cell holds value for item-attribute pair –unique key (could be implicit)
16
Tables
Attributes (columns) Items (rows) Cell containing value
Tables
Items Attributes
item: person attributes: name, age, shirt size, fave fruit