
https://www.cs.ubc.ca/~tmm/courses/436V-20
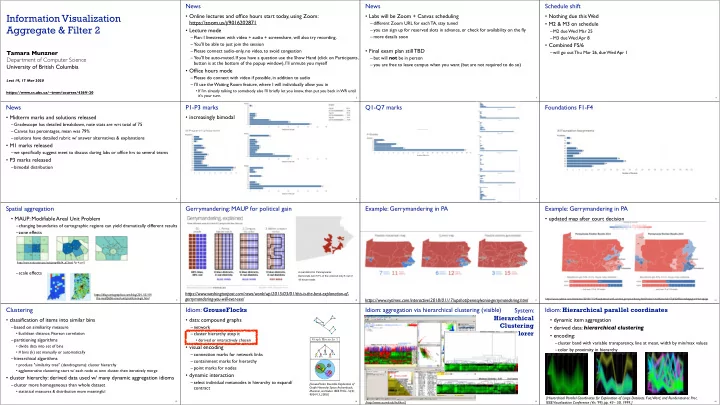
Information Visualization Aggregate & Filter 2
Tamara Munzner Department of Computer Science University of British Columbia
Lect 19, 17 Mar 2020
News
- Online lectures and office hours start today, using Zoom:
https://zoom.us/j/9016202871
- Lecture mode
–Plan: I livestream with video + audio + screenshare, will also try recording. –You'll be able to just join the session –Please connect audio-only, no video, to avoid congestion –You'll be auto-muted. If you have a question use the Show Hand (click on Participants, button is at the bottom of the popup window), I'll unmute you myself
- Office hours mode
–Please do connect with video if possible, in addition to audio –I'll use the Waiting Room feature, where I will individually allow you in
- If I'm already talking to somebody else I'll briefly let you know, then put you back in WR until
it's your turn.
2
News
- Labs will be Zoom + Canvas scheduling
–different Zoom URL for each TA, stay tuned –you can sign up for reserved slots in advance, or check for availability on the fly –more details soon
- Final exam plan still TBD
–but will not be in person –you are free to leave campus when you want (but are not required to do so)
3
Schedule shift
- Nothing due this Wed
- M2 & M3 on schedule
–M2 due Wed Mar 25 –M3 due Wed Apr 8
- Combined F5/6
–will go out Thu Mar 26, due Wed Apr 1
4
News
- Midterm marks and solutions released
–Gradescope has detailed breakdown, note stats are wrt total of 75 –Canvas has percentages, mean was 79% –solutions have detailed rubric w/ answer alternatives & explanations
- M1 marks released
–we specifically suggest meet to discuss during labs or office hrs to several teams
- P3 marks released
–bimodal distribution
5
P1-P3 marks
- increasingly bimodal
6
Q1-Q7 marks
7
Foundations F1-F4
8
Spatial aggregation
- MAUP: Modifiable Areal Unit Problem
–changing boundaries of cartographic regions can yield dramatically different results –zone effects –scale effects
9
[http://www.e-education.psu/edu/geog486/l4_p7.html, Fig 4.cg.6]
https://blog.cartographica.com/blog/2011/5/19/ the-modifiable-areal-unit-problem-in-gis.html
Gerrymandering: MAUP for political gain
10
https://www.washingtonpost.com/news/wonk/wp/2015/03/01/this-is-the-best-explanation-of- gerrymandering-you-will-ever-see/
A real district in Pennsylvania: Democrats won 51% of the vote but only 5 out of 18 house seats
Example: Gerrymandering in PA
11
https://www.nytimes.com/interactive/2018/01/17/upshot/pennsylvania-gerrymandering.html
Example: Gerrymandering in PA
- updated map after court decision
12
https://www.nytimes.com/interactive/2018/11/29/us/politics/north-carolina-gerrymandering.html?action=click&module=Top%20Stories&pgtype=Homepage
Clustering
- classification of items into similar bins
–based on similiarity measure
- Euclidean distance, Pearson correlation
–partitioning algorithms
- divide data into set of bins
- # bins (k) set manually or automatically
–hierarchical algorithms
- produce "similarity tree" (dendrograms): cluster hierarchy
- agglomerative clustering: start w/ each node as own cluster, then iteratively merge
- cluster hierarchy: derived data used w/ many dynamic aggregation idioms
–cluster more homogeneous than whole dataset
- statistical measures & distribution more meaningful
13
Idiom: GrouseFlocks
14
- data: compound graphs
–network –cluster hierarchy atop it
- derived or interactively chosen
- visual encoding
–connection marks for network links –containment marks for hierarchy –point marks for nodes
- dynamic interaction
–select individual metanodes in hierarchy to expand/ contract
[GrouseFlocks: Steerable Exploration of Graph Hierarchy Space. Archambault, Munzner, and Auber. IEEE TVCG 14(4): 900-913, 2008.] Graph Hierarchy 1
Idiom: aggregation via hierarchical clustering (visible)
15
System: Hierarchical Clustering Explorer
[http://www.cs.umd.edu/hcil/hce/]
Idiom: Hierarchical parallel coordinates
- dynamic item aggregation
- derived data: hierarchical clustering
- encoding:
–cluster band with variable transparency, line at mean, width by min/max values –color by proximity in hierarchy
16
[Hierarchical Parallel Coordinates for Exploration of Large Datasets. Fua, Ward, and Rundensteiner. Proc. IEEE Visualization Conference (Vis ’99), pp. 43– 50, 1999.]