
SLIDE 1
Industrial Industry Energy Demand Increases 250 Quadrillion BTUs - - PowerPoint PPT Presentation
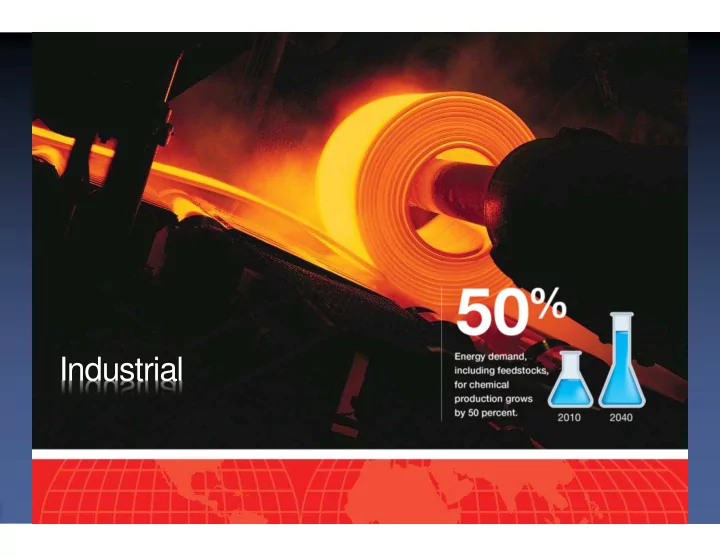
Industrial Industry Energy Demand Increases 250 Quadrillion BTUs 200 Paint Paint Fertilizer Fertilizer Plastics Plastics 150 Chemicals Textiles Textiles 100 Automobiles Automobiles Steel Steel Manufacturing & Industry
50 100 150 200 250 1990 2015 2040
Chemicals Manufacturing & Industry Energy Industry Other
Plastics Plastics Fertilizer Fertilizer Paint Paint Steel Steel Automobiles Automobiles Textiles Textiles Liquid Fuels Liquid Fuels Coal Coal Natural Gas Natural Gas Agriculture Agriculture Lubricants Lubricants Asphalt Asphalt
Quadrillion BTUs
ExxonMobil 2013 Outlook for Energy
50 100 150 200 250 2000 2020 2040
By Fuel
Quadrillion BTUs Electricity Oil Gas Renewables Coal
50 100 150 200 250 2000 2020 2040 By Region
Quadrillion BTUs OECD China India Rest of Non OECD Market Heat
ExxonMobil 2013 Outlook for Energy
5 10 15 20 25 2000 2020 2040 5 10 15 20 25 2000 2020 2040
Non OECD
Thousand TWh Middle East Southeast Asia Russia/Caspian Other Non OECD China Africa India Thousand TWh North America Europe OECD Other OECD
OECD
ExxonMobil 2013 Outlook for Energy
50 100 150 200 250 300 2000 2020 2040 Electricity Generation
Quadrillion BTUs Oil Nuclear Gas Renewables Coal
Electricity Generation 50 100 150 200 250 300 2000 2020 2040
Quadrillion BTUs OECD Non OECD
ExxonMobil 2013 Outlook for Energy
30 60 90 120 Non OECD OECD Growth in Fuels from 2010 to 2040
Quadrillion BTUs Oil Nuclear Gas Renewables Coal
200 400 600 800 1000 1200 Nuclear Wind Solar
GW
Global Capacity 200 400 600 800 1000 1200 Nuclear Wind Solar Global Capacity Utilized
GW
5 10 15 20 25 30 35 2000 2020 2040
k TWh
By Generation
Wind & Solar Oil Coal Nuclear Other Renewables Gas
ExxonMobil 2013 Outlook for Energy
15 30 45 60 75 2000 2020 2040 Sector Demand
MBDOE Light Duty Marine Rail Heavy Duty Aviation
ExxonMobil 2013 Outlook for Energy
5 10 15 20 25 30 AP NA Europe LA ME ROW Demand by Region
MBDOE ‘40 ‘25 ‘10
100 200 300 400 500 North America Europe OECD Other OECD China India Middle East Latin America Other Non OECD
PHV/EV Full Hybrid CNG LPG Diesel Conv Mogas Conv
Millions of Vehicles
Powertrain Technology 100 200 300 400 500 North America Europe OECD Other OECD China India Middle East Latin America Other Non OECD
Advanced* CNG LPG
Millions of Vehicles
Powertrain Technology 100 200 300 400 500 North America Europe OECD Other OECD China India Middle East Latin America Other Non OECD
Advanced* CNG LPG
Millions of Vehicles
Powertrain Technology
*Full Hybrid, Plug-in Hybrid, Electric Vehicles
ExxonMobil 2013 Outlook for Energy
25 50 75 100 125 150 2010 2015 2020 2025 2030 2040
Elec/PHV Full Hybrid Natural Gas
5 10 15 20 2010 2020 2030 2040 Incremental Vehicle Efficiency Gains
Miles per Gallon Powertrain Body & Accessories Vehicle Size Hybrid Average 27 MPG 47 MPG
Annual New Car Sales by Type
Million Cars
ExxonMobil 2013 Outlook for Energy
Gasoline: 350 miles Diesel: 435 miles E85: 260 miles Full hybrid: 515 miles CNG: 210 miles PHV: Up to 40 miles + 450 miles Electric: Up to 100 miles 5 10 15 20 Full Hybrid CNG Plug-in Hybrid Elec 2012$k
5-Year Cost & Savings Cost above Conventional Fuel Savings Estimated Driving Distance per Fill-up
ExxonMobil 2013 Outlook for Energy
15 30 45 2010 2025 2040
Demand w/o Efficiency Demand
Efficiency Impact
MBDOE
15 30 45 60 75 '10-'25 '25-'40 Other New Truck Efficiency
% Improvement, 2010-2040
Technology
Powertrain Body Powertrain Body Hybrid
Regional Impact
Logistics & Congestion Truck Size
ExxonMobil 2013 Outlook for Energy
15 30 45 60 75 2000 2020 2040
3 6 9 12 15 Gasoline Diesel Jet Fuel Fuel Oil Natural Gas Other
Non OECD OECD
Growth in Demand from 2010 to 2040
MBDOE
Fuel Demand
MBDOE Diesel Gasoline Ethanol Biodiesel Jet Fuel Fuel Oil Other Natural Gas
ExxonMobil 2013 Outlook for Energy
Renewable Nuclear Gas Oil Hydro Coal Wood
0% 5% 10% 15% 20% 25% 30% 35% 40% 45% 50% 1970 1975 1980 1985 1990 1995 2000 2005
Oil Natural gas Coal Hydro
Oil Coal Gas Hydro Nuclear
Nuclear Oil
78% 10% 61% 15% 88% 65% 22% 90% 39% 85% 12% 35% Consumption Reserves Consumption Reserves Consumption Reserves OIL GAS COAL 3 Largets Energy Markets (N.America + Europe + Asia Pacific) ROW
Source: BP Statistical Review 2006
ROW = Rest of World
Availability of oil resources as a function of economic price
Source: IEA (2005)
2.000 2.000 2.000 2.000 4.000 4.000 4.000 4.000 6.000 6.000 6.000 6.000 8.000 8.000 8.000 8.000 10.000 10.000 10.000 10.000 12.000 12.000 12.000 12.000 14.000 14.000 14.000 14.000 16.000 16.000 16.000 16.000 18.000 18.000 18.000 18.000
1980 1980 1980 1980 2004 2004 2004 2004 2010 2010 2010 2010 2015 2015 2015 2015 2030 2030 2030 2030
Other Renewables Other Renewables Other Renewables Other Renewables Biomass & waste Biomass & waste Biomass & waste Biomass & waste Hydro Hydro Hydro Hydro Nuclear Nuclear Nuclear Nuclear Gas Gas Gas Gas Oil Oil Oil Oil Coal Coal Coal Coal
Source: IEA World Energy Outlook 2006 (Reference Case)
’04 ’04 ’04 ’04 – – – – ’30 Annual Growth ’30 Annual Growth ’30 Annual Growth ’30 Annual Growth Rate (%) Rate (%) Rate (%) Rate (%)
6.5 1.3 2.0 0.7 2.0 1.3 1.8 Note: ‘Other renewables’ include geothermal, solar, wind, tide and wave energy for electricity generation
1.000 2.000 3.000 4.000 5.000 6.000 Oil Oil Oil Oil Gas Gas Gas Gas Coal Coal Coal Coal
R/P Ratio R/P Ratio R/P Ratio R/P Ratio 41 yrs. 41 yrs. 41 yrs. 41 yrs. R/P Ratio R/P Ratio R/P Ratio R/P Ratio 67 yrs. 67 yrs. 67 yrs. 67 yrs. R/P Ratio R/P Ratio R/P Ratio R/P Ratio 164 yrs. 164 yrs. 164 yrs. 164 yrs. Yet to Find
Source: World Energy Assessment 2001, HIS, WoodMackenzie, BP Stat Review 2005, BP estimates
Unconventional Unconventional Reserves & Resources (bnboe) Reserves & Resources (bnboe) Reserves & Resources (bnboe) Reserves & Resources (bnboe)
technologies and price deck
260 211 175 138 115 102 98 60 46 37 30 25 21 20 13 12 12 10 7 7 75
50 100 150 200 250 300
Total Reserves: 1.471 trillion bo R/P = 46 yrs (*) Including extra heavy and oil sands
Source: EIA , International Energy Outlook Issue: October 2011
20 40 60 80 100 120 1990 1995 2000 2005 2010 2015 2020 2025 2030
World Crude Oil and Liquid Fuels Consumption MMb/day
Non Conv Conv Non Opec Conv Opec Current Prod Proj
Liquids: Conventional (oil, condensate, natural gas plant liquids, refinery gains) Non-Conventional (oil sands, extra heavy oil, biofuels, GTL, CTL) Source: EIA Outlook Issue: October 2011
108 87.8
4 8 12 16
Opec Liquids Production mmb/day
2008 2035
Source: EIA , International Energy Outlook Issue: October 2011 Liquids: Conventional (oil, condensate, natural gas plant liquids, refinery gains) Non-Conventional (oil sands, extra heavy oil, biofuels, GTL, CTL)
4 8 12 16
Non Opec Liquids Production Mmb/day
2008 2035
Lower Aptian reconstitution (122 m.y.) Pre Salt deep
Orinoco Extra heavy oil Ultra deep Gulf of Mexico
Source: IHS, ANP, Woodmac
Santos Basin largest oil discoveries (mmbo)
400 800 1200 1600
World Gas Reserves (2010) -TCF Source: BP Statistical Review, 2011
tcf
technologies and price deck
Source: EIA , International Energy Issue: October 2011
Natural gas production grow will be mainly from the Middle East, Asia and Eurasia, with increasing contribution o conventional sources
20 40 60 80 00 20 40 60 80 2008 2009 2015 2020 2025 2030 2035 Natural Gas Production tcf/year
RoW Russia OECD Non Conventional OECD Conventional
5 10 15 20 Natural Gas Production Change 2008-2035 tcf/year
Crude and Condensate (BBO)
North America Europe ~100 Asia Pacific ~150 Latin America Africa Russia/Caspian ~1,000 Middle East ~650 ~200 ~1,100 ~1,100 Global ~4,300
Source: IEA ExxonMobil 2013 Outlook for Energy
20 40 60 80 100 120 2000 2010 2020 2030 2040
MBDOE
Supply by Type
Other Liquids Biofuels Conventional Crude & Condensate
Tight Oil
Oil Sands NGLs Deepwater
1 2 3 4 5 6 2040 Resource*
TBO Remaining Resource Cumulative Production
* Source: IEA ExxonMobil 2013 Outlook for Energy
Over 200 years coverage at current demand
5 10 15 20 25 30 World
1000 TCF Conventional Unconventional 4.3 North America 2.5 Latin America 1.6 Europe OECD 2.6 Africa 4.9 Middle East 6.2 Russia/ Caspian* 4.5 Asia Pacific
Source: IEA; *Includes Europe Non OECD ExxonMobil 2013 Outlook for Energy
20 40 60 80 100 120 2010 2025 2040 North America Gas Supply
Local Unconventional LNG Local Conventional BCFD
100 200 300 400 500 600 2010 2025 2040
North America Conventional
North America Unconventional
Global Gas Supply
Rest of World Conventional Rest of World Unconventional BCFD
ExxonMobil 2013 Outlook for Energy
50 100 150 200 2000 2020 2040 50 100 150 200 2000 2020 2040
Production by Region
BCFD
Production by Type
BCFD Tight Coal Bed Methane Shale Rest of World Asia Pacific Americas
ExxonMobil 2013 Outlook for Energy