
SLIDE 1
1
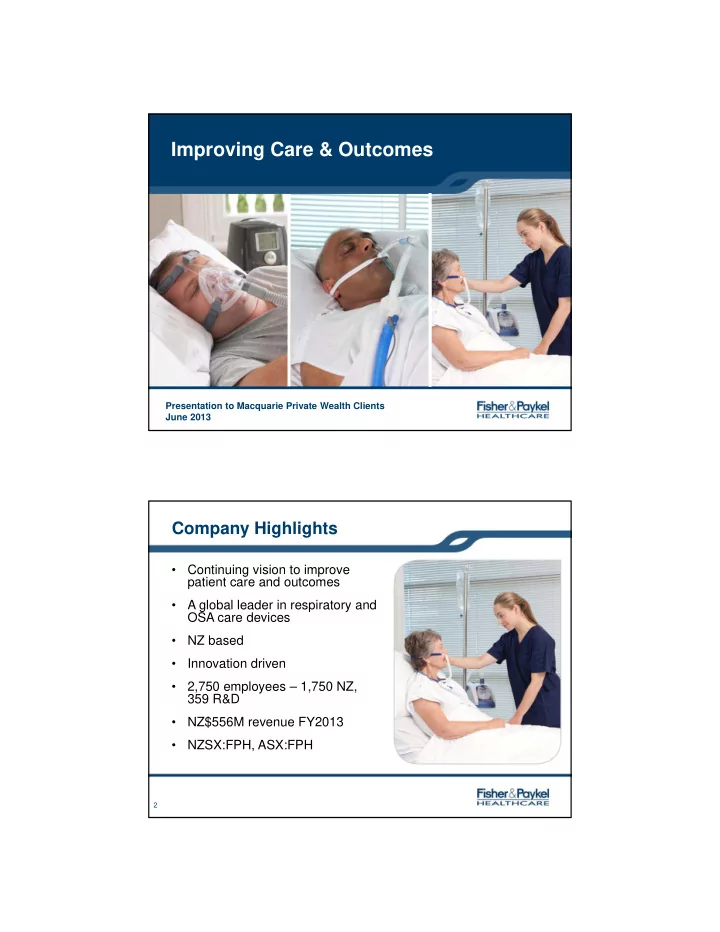
Improving Care & Outcomes
Presentation to Macquarie Private Wealth Clients June 2013
2
Company Highlights
- Continuing vision to improve
patient care and outcomes
- A global leader in respiratory and
OSA care devices
- NZ based
- Innovation driven
- 2,750 employees – 1,750 NZ,
359 R&D
- NZ$556M revenue FY2013
- NZSX:FPH, ASX:FPH