
SLIDE 1
10/21/2019 1
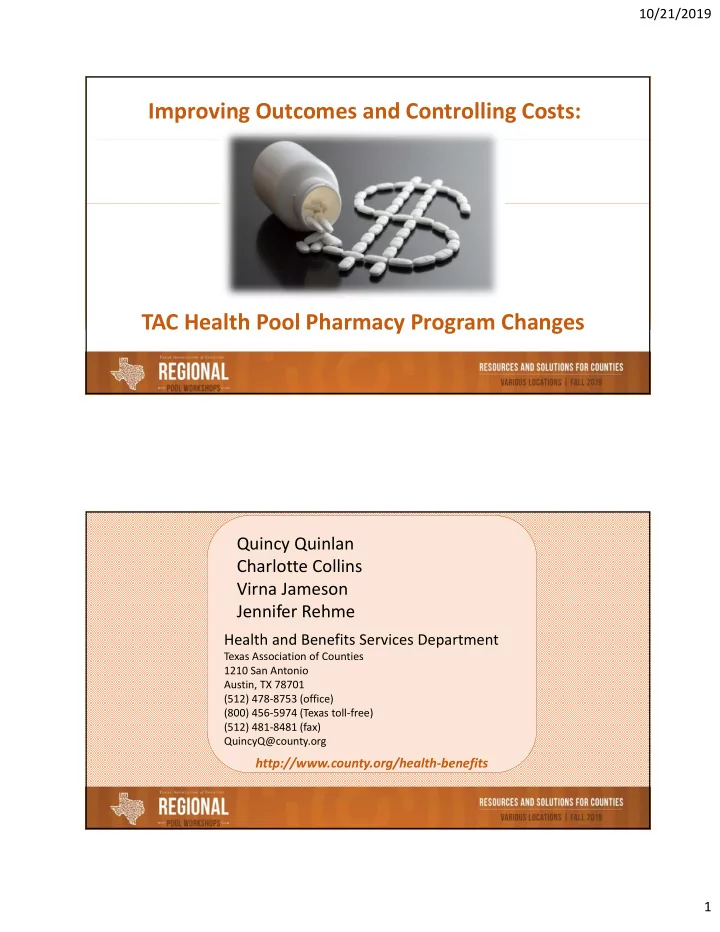
Improving Outcomes and Controlling Costs: TAC Health Pool Pharmacy Program Changes Improving Outcomes and Controlling Costs: TAC Health Pool Pharmacy Program Changes
Improving Outcomes and Controlling Costs: TAC Health Pool Pharmacy Program Changes
Quincy Quinlan Charlotte Collins Virna Jameson Jennifer Rehme
Health and Benefits Services Department
Texas Association of Counties 1210 San Antonio Austin, TX 78701 (512) 478‐8753 (office) (800) 456‐5974 (Texas toll‐free) (512) 481‐8481 (fax) QuincyQ@county.org
http://www.county.org/health‐benefits