
SLIDE 1
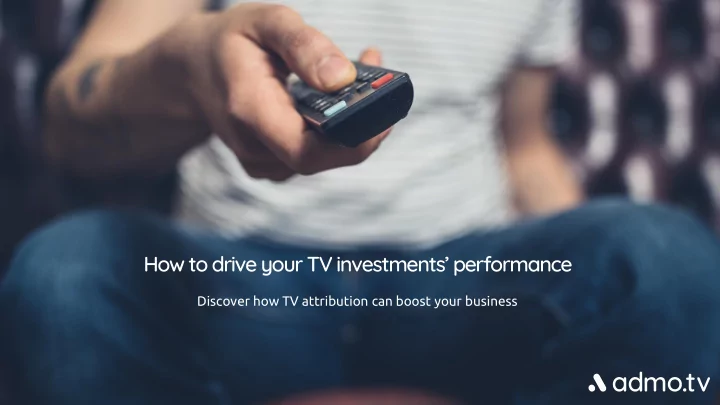
How to drive your TV investments’ performance
Discover how TV attribution can boost your business
How to drive your TV investments performance Discover how TV - - PowerPoint PPT Presentation
How to drive your TV investments performance Discover how TV attribution can boost your business The TV attribution platform for measuring the impact of TV & Radio advertising +450 +2 000 EMEA clients campaigns Coverage analysed
Discover how TV attribution can boost your business
clients
campaigns analysed
Coverage
Create a unique currency for media measurement & optimisation
How TV campaigns are often run?
01
Using GRP data to purchase TV spots
02
Lack of spot detection
03
Lack of attribution
04
Lack of profiling analysis of the TV campaign engaged audience
The issue : the lack of data visibility in TV
No KPIs Is Data on targeted audience and investment but no data on engaged performance Many KPIs Is Measurable digital Investment with data on performance
Dig igita tal VS VS tele levis ision ion
A brand recall impact twice as strong as the one from digital ads**
their digital investment * BRANDING PERFORMANCE
StudieshaveshownthatTVadshave multiple impacts
*Admo.tv study on 810 000 ads between 2017 & 2018 / **Study Bain Insights for Forbes, “To Keep A Consumer Brand Top Of Mind, Consider Old-School Advertising”, Feb 2017 /
With TV analytics we can now
01 02 03 04 Detect
in real time the airtime of your TV and Radio spot
Measure
the increased visits generated by your TV spots on your website and app
Attribute
the conversions generated by your TV spots
Analyse
the engaged audience due to your TV spots (socio-demo, geos...)
05 Amplify
your conversions by synchronising your SEM & retargeting
Our ad detection technology
We develop an algorithm that creates live recognition of audio & video fingerprints.
Real Time Competitors Context
Detect 01 Attribute Analyse 02 03 04 Measure Amplify 05
V I S I T S T I M E 2 0 4 0 6 0
03 04 05 01 02 Detect Measure Attribute Analyse Amplify
Why measure visits brought by TV?
Discover how TV impacts your online performance & how you can improve it
What impact does TV advertisement have on your
How to optimise your media planning according to your goals?
How many visits per:
How to measure TV visits?
02 03 04 05 01 Detect Measure Attribute Analyse Amplify
Tag your website
traffic in r real eal time, second by second V I S I T S T I M E 2 0 4 0 6 0
How to measure TV visits?
02 03 04 05 01 Detect Measure Attribute Analyse Amplify
Tag your website
traffic in r real eal time, second by second
trapo pola lati tion
r website’s organic traffic in real time V I S I T S T I M E 2 0 4 0 6 0
02 03 04 05 01 Detect Measure Attribute Analyse Amplify
antify the incremental visits between the baseline and actual traffic
Tag your website
traffic in r real eal time, second by second
trapo pola lati tion
r website’s organic traffic in real time
How to measure TV visits?
V I S I T S T I M E 2 0 4 0 6 0
What can you do thanks to TV attribution?
Follow conversions brought by TV and leverage this audience in your digital actions. V I S I T S T I M E 2 0 4 0 6 0 What impact does TV advertisement have on your online sales ? demo request? subscriptions ? How many conversions per channel, days, day parts and spot versions? At what cost? Where has your TV ad generated the most engagement from your target?
03 04 05 01 02 Detect Measure Attribute Analyse Amplify
How to identify your TV visitors? 03 04 05 01 02 Detect Measure Attribute Analyse Amplify
40+ criteria
V I S I T S T I M E 2 0 4 0 6 0
TV VISITS
Discover who are your TV engaged visitors
Is your panel of TV-engaged visitors similar to your purchased GRP or your online target? V I S I T S T I M E 2 0 4 0 6 0 Women : 23% Men : 77% Parents : 66% No children: 34% SEO : 73% SEA: 27% #1 Shopping & Fashion
#2 Travel
#3 Technology
04 01 02 03 05 Detect Measure Attribute Analyse Amplify
Export of the TV segment that is sent to your Facebook, Google Analytics or DMP Analysis of TV-engaged visitors according to their socio-demographic profiles and interests.
Amplify your TV conversions
Synchronise your SEM – Retarget your TV-engaged-audience
Boost
05 01 02 03 04
your TV acquisition by increasing bids during your TV ad airing. your brand and ensure higher
rankings on Google Ads. your searches generated by TV ads of your competitions. your TV engaged- audience to your advertising during their
your landing pages of your TV- engaged- audience to offer them a tailor made experience. Protect Maximise Retarget Personalise
Detect Measure Attribute Analyse Amplify
AND
ITE
APP STRAT ATEGICAL CAL RECOMM MMEN ENDA DATIONS S
Analyse the global impact of your TV & VOD investments
TV Main Figures
Visits per spot (direct + indirect)
Ads tracked
TV visitors (direct + indirect)
Cost per visit (direct + indirect)
Direct vs indirect visits repartition
Scope: 60 non pure player advertisers, with a natural traffic inferior to 100 visitors/minute, having calculated the indirect effect of their campaign
Key Indicators Global Data Branding Indicators
TV Main Figures
Cost per direct visit (all type of advertisers): £20 Cost per direct visit and indirect visit: £8 CPM: £1.6 Direct Email
Social Media
Display
Paid Search
TV KPI against other media
4 keys insights about the online impact of TV ads in the UK
Scope : 150 000 spots tracked between September 2018 and June 2019.
For Pure Players
performing format VS For Brick & Mortars
performing format Impact on Ad Positioning
when the slot is delivered immediately after the end of the TV program
Impact of Sponsorship
more visits
During Peak Time vs
visits/spot on Sunday
for bricks & mortar’s advertisers vs the average day of the week
Objective: Measuring TV impact on website. Results: 47% increase in traffic due to TV
Case Studies: How TV Analytics can impact your campaigns?
Objective: Maximising
Results: -60% decrease in cost per vist 4 times more visits per spots. Objective: Improve return
Results: -63% decrease in cost per conversion
Au Automotive Client nt
Worki rking with Ad Admo.tv
18
Telecom Clien ent
Worki rking with Ad Admo.tv
18
Finance nce Client nt
Worki rking with Ad Admo.tv
18