how much radiation does
play

How much radiation does Scrutiny of the increasing use of CT scans - PDF document

10/6/2017 Recent history of radiation safety Risks of Radiation In 2012, American Board of Internal Medicine Foundation launched the Choosing Wisely Exposure: Myths vs Reality initiative - to avoid wasteful or unnecessary medical tests,


  1. 10/6/2017 Recent history of radiation safety Risks of Radiation • In 2012, American Board of Internal Medicine Foundation launched the Choosing Wisely Exposure: Myths vs Reality initiative - to avoid wasteful or unnecessary medical tests, treatments, and procedures Sue S. Yom, MD, PhD, MAS Associate Professor, UCSF Radiation Oncology • American College of Radiology launched the Image Wisely campaign - to eliminate unnecessary imaging and use the minimum amount of radiation needed for an indicated test How much radiation does Scrutiny of the increasing use of CT scans a person really receive • Doctors rely more on scans as the technical quality and speed of imaging have improved • Annual growth of around 8% in the use of CT scans in the past decade • Physicians mostly decide when to order tests with little standardized guidance • Voluntary guidelines are a weak lever to change physician practice behavior • Institutions have little incentive to reduce scanning
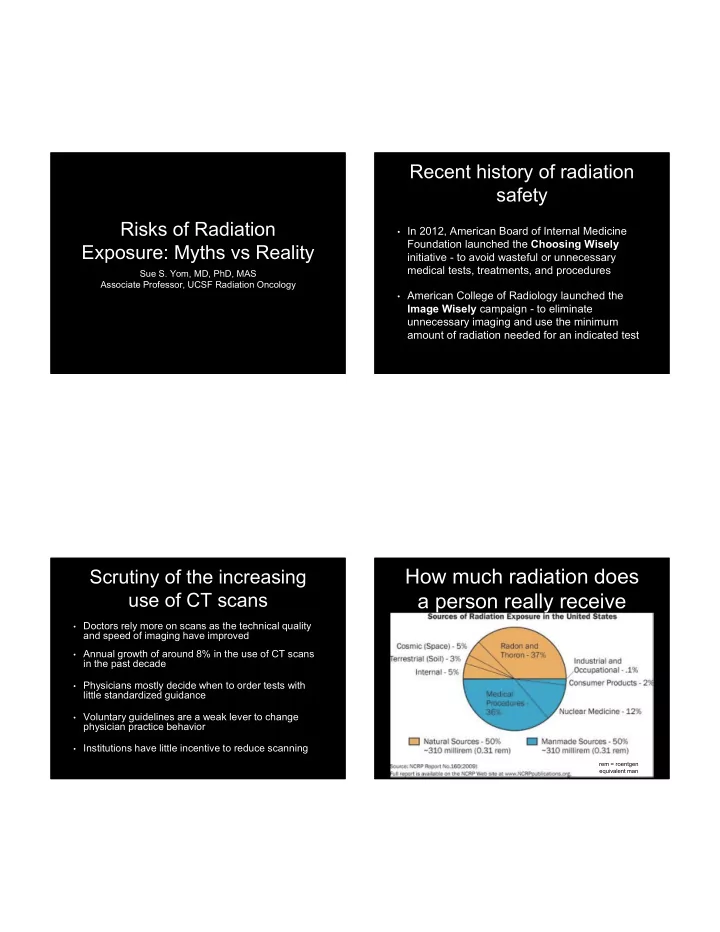
 rem = roentgen equivalent man 1

  2. 10/6/2017 How much radiation does Examples of “natural” a person really receive radiation • Foods such as bananas and Brazil nuts contain Radiation is everywhere – in space, in the ground, in our food, • higher levels of radiation water, air, homes and in our own bodies Average U.S. resident receives annual exposure of 620 mrem • • Brick and stone homes have higher radiation levels Natural and internal sources = 310 millirem • than wood homes 2/3 rd = radon and thoron gases from Earth’s crust and in the air • 1/3 rd = cosmic, terrestrial, and internal radiation (food and water) • The U.S. Capitol is largely built of granite and • contains radiation Manmade sources = 310 mrem • 150 mrem from CT scan • • Colorado has more cosmic radiation because of its altitude and it has more terrestrial radiation from soils 150 mrem from other medical procedures • rich in uranium 10 mrem from tobacco, fertilizer, welding rods, exit signs, • luminous watch dials and smoke detectors Examples of “internal” NRC standards radiation • All organic plant and animal • Annual average dose per person is 620 mrems matters contains radioactive potassium-40 ( 40 K), radium-226 • U.S. Nuclear Regulatory Commission (NRC) ( 226 Ra), and other isotopes standards recommend additional exposures of: • All water on Earth contains small amounts of dissolved • 5,000 mrem per year for persons working with uranium and thorium and around radioactive material • Average person receives an • 100 mrem extra per year for members of the average internal dose of about general public 30 mrem from food and water 2

  3. 10/6/2017 Personal annual dose Personal annual dose calculator calculator https://www.nrc.gov/about-nrc/radiation/around-us/calculator.html Radiation and cancer Therapeutic radiation Information comes from survivors of the atomic bombs in • Japan or studies of people who have received very large amounts of radiation for medical tests or treatment Exposure >50,000 mrem (500 x the NRC limit for general • public) is associated with leukemia, breast, bladder, colon, liver, lung, esophagus, ovarian, multiple myeloma and stomach cancers Chemical and physical hazards and lifestyle factors • (smoking, alcohol consumption and diet) are related to these same diseases • Gray – total absorbed energy of the radiation • Sievert – accounts for type of particles and tissues involved No data showing a link between cancer and doses below • 10,000 mrem (100 times the NRC limit) • For X-rays and gamma rays 1 mGy = 1 mSv, 1mSv = 100 mrem • Dose for radiation therapy ~30,000-60,000 mGy (mSv) =3,000,000- 6,000,000 rem or 3000-6000x the annual NRC max dose 3

  4. 10/6/2017 Cost/benefit of therapeutic Radiation induced radiation malignancy • Called “radiation oncology” or “radiation therapy” • Radiation-induced leukemias (blood cancers) typically require 2–10 years to appear – much • Therapeutic radiation after surgery is usually justified higher risk from chemotherapy rather than radiation based on a 20-25% reduction in cancer recurrence • Radiation-induced solid tumors usually take 10–15 • Therapeutic radiation (without preceding surgery) is years to clinically manifest usually justified for at least 50% chance of cure • French breast cancer radiation patients: increased risk of sarcoma of 0.28% to 0.48% • This is balanced against the known risks of acute toxicity (usually severe for some weeks) as well as • United States and Sweden breast cancer the <1% increased risk of “radiation induced radiation patients: 0.5% increased lung cancer malignancy” over the general risk risk but only seen in smokers Risk is very dependent on Radiation safety is based individual characteristics on the ALARA principle Whole body radiation is highest risk; then site specific e.g. highest • • ALARA = “As Low As Reasonably Achievable” risk to testes, cervix, non-limb soft tissue, salivary gland, with low risk to orbit, oral/pharynx/larynx, female breast • Radiation protection guidelines are based on the “linear no-threshold” model of risk Recent SEER database study: of 647,672 patients, 60,271 (8%) had • a second cancer but only 3,266 (0.5%) were related to radiation • Assumes that no dose of radiation is safe – this 5 excess cancers per 1000 radiotherapy patients at 15 years after • model is very conservative and overestimates risk diagnosis Much greater risks of cancer from lifestyle (e.g. smoking), • • One millisievert (100 mrem)  0.0055% chance of carcinogenic exposures, and genetics eventually developing cancer Persons with complex genetic syndromes e.g. retinoblastoma, are • more susceptible • 6.2 mSv (average annual exposure)  0.0341% baseline risk Children and adolescents are twice as likely to develop radiation- • induced leukemia as adults, and live longer to develop solid cancers de Gonzalez et al, Lancet Oncology April 2011 4

  5. 10/6/2017 6.2 mSv (average annual exposure)  0.0341% 6.2 mSv (average annual exposure)  0.0341% https://www.acr.org/~/media/ACR/Documents/PDF/QualitySafety/Radia What is being done about tion-Safety/Dose-Reference-Card.pdf?la=en CT scans Establish standardized metrics – across health systems or • by national organizations – to assist physicians in ordering only for high likelihood of benefit University of California CT dose standardization • DecisionSelect by the American College of Radiology • Penalties – physicians who order more scans than their • peers will be at financial risk Evaluation via Medicare Incentive Payment System • (MIPS) or join an Accountable Care Organization (ACO) MIPS reimbursement penalties will start at 4% at risk in • 2019 and increase to 9% by 2022 6.2 mSv (average annual exposure)  0.0341% 5

  6. 10/6/2017 Conclusions • Awareness of exogenous (non-natural, non- internal) radiation exposure is increasing • Overall the risk to a given individual is very low, but it is a public health concern on the population level • Medical procedures should always be done for appropriate reasons with consideration of all short and long term effects 6

Download Presentation
Download Policy: The content available on the website is offered to you 'AS IS' for your personal information and use only. It cannot be commercialized, licensed, or distributed on other websites without prior consent from the author. To download a presentation, simply click this link. If you encounter any difficulties during the download process, it's possible that the publisher has removed the file from their server.

Recommend


More recommend