
SLIDE 1
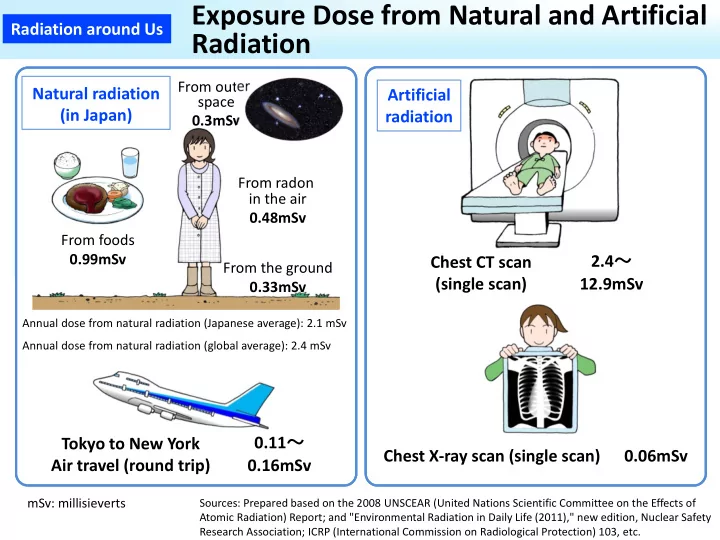
Exposure Dose from Natural and Artificial Radiation
Sources: Prepared based on the 2008 UNSCEAR (United Nations Scientific Committee on the Effects of Atomic Radiation) Report; and "Environmental Radiation in Daily Life (2011)," new edition, Nuclear Safety Research Association; ICRP (International Commission on Radiological Protection) 103, etc.
Chest CT scan (single scan) 2.4〜 12.9mSv Tokyo to New York Air travel (round trip) 0.11〜 0.16mSv Artificial radiation Natural radiation (in Japan)
From the ground 0.33mSv From outer space 0.3mSv From radon in the air 0.48mSv From foods 0.99mSv
mSv: millisieverts
Annual dose from natural radiation (Japanese average): 2.1 mSv Annual dose from natural radiation (global average): 2.4 mSv