Use of dose-exposure-response model in immunology/transplantation - - PowerPoint PPT Presentation
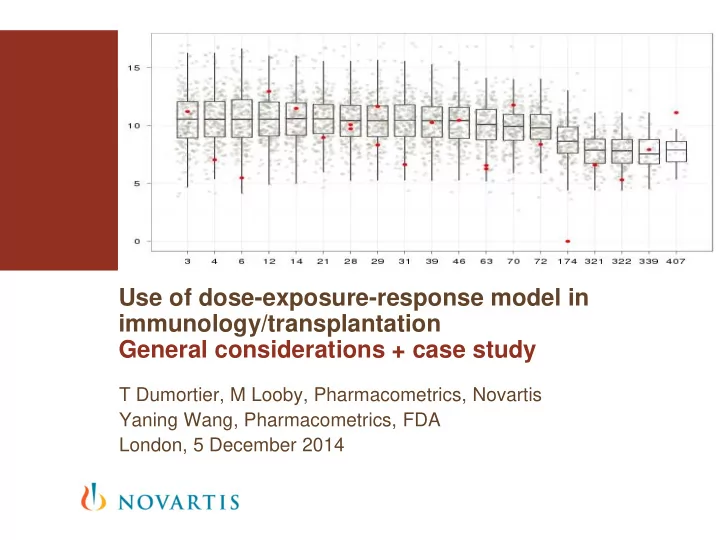
Use of dose-exposure-response model in immunology/transplantation General considerations + case study T Dumortier, M Looby, Pharmacometrics, Novartis Yaning Wang, Pharmacometrics, FDA London, 5 December 2014 Challenges in dose-finding in
Challenges in dose-finding in immunology
- The most active area of pharmaceutical research
- Some challenges
- Many novel long acting biologics
- Need to optimize for both dose and regimen
- Benefit-risk sometimes driven by primary pharmacology with narrow therapeutic window
- May require dose individualization
- Multiple targets on overlapping pathways in related but different diseases
- Suitable for combination therapy. How do we optimize both drugs?
- Challenges in accounting for impact of comorbidities on benefit-risk
- Response may be considerably delayed. How do we individualize?
- Sometimes sub-optimal treatment is not an option
- May lack placebo control or may not be able to explore whole dose response relationship
- Traditional approaches cannot adequately support dose finding in many cases
- Model based methods, particularly pharmacometrics based approaches can and do fill the gap
- However, with the industry there is the perception that such methods are not accepted by Regulatory
Authorities
- Furthermore, lack of experience in the implementation of more complex methods further inhibit adoption
- The case study presents an example of how PMX based methods can bridge the gap
2 | T Dumortier | Dose finding in immunology – transplantation | London December 2014
Case study
- FDA’s requirement for a combination therapy including a novel agent:
To show that the novel agent has an efficacy contribution to the new combination
- This is impossible when there is no ‘placebo’ efficacy information
- This situation occurred for a sNDA for a combination regimen including
everolimus (EVR) in liver transplantation
- The challenge was addressed using a pharmacometric approach
combining population PK and time-to-event analyses
- Those analyses proved the efficacy contribution of EVR; the
combination regimen was subsequently approved
- This was enable by the use of a rigorous and adequate methodology
3 | T Dumortier | Dose finding in immunology – transplantation | London December 2014
sNDA=supplemental New Drug Application FDA=Food and Drug Administration
Background
Efficacy requirement for a novel agent in combination
4
- Regulatory requirement for a combination therapy which includes a
novel agent: To show that the novel agent has a contribution to the efficacy of the new combination*
* FDA/CDER/CBER. Food and Drug Administration Center for Drug Evaluation and Research. Guidance for Industry: Codevelopment
- f Two or More Unmarketed Investigational Drugs for Use in Combination, December 2010.
New agent Co- medic.
New Combination ‘Placebo’
Co- medic.
>
- How? by comparing the
efficacy of the combination to that of ‘placebo’ (= the combination MINUS the novel agent)
| T Dumortier | Dose finding in immunology – transplantation | London December 2014
M1 is “what is thought to be the whole effect of the active control relative to placebo in the NI study” *
Background
Efficacy contribution can be proved via direct/indirect comparison
5
Contribution Probability of first event
‘Placebo’ controlled study
DIRECT INDIRECT
Historical data
Probability of first event M1
Non inferiority (NI) study
Probability of first event Contribution
* FDA/CDER/CBER. Food and Drug Administration Center for Drug Evaluation and Research. Guidance for Industry: Non-inferiority clinical trials (Draft).
M1
| T Dumortier | Dose finding in immunology – transplantation | London December 2014
M1 is “what is thought to be the whole effect of the active control relative to placebo in the NI study” *
Challenge
Issue when no available efficacy information for ‘placebo’
6
Contribution Probability of first event
‘Placebo’ controlled study
DIRECT INDIRECT
Historical data
Probability of first event M1
Non inferiority (NI) study
Probability of first event Contribution
* FDA/CDER/CBER. Food and Drug Administration Center for Drug Evaluation and Research. Guidance for Industry: Non-inferiority clinical trials (Draft).
M1
| T Dumortier | Dose finding in immunology – transplantation | London December 2014
Case study: Liver transplantation - Phase III
Non-inferiority study with 2 EVR based combinations and active control
- No efficacy information for Low TAC ( ‘placebo’)
- Non-inferiority margin decided based on clinical consideration
- Therapeutic drug monitoring:
7
[NCT00622869]
Low TAC: 3-5 ng/mL; High TAC: 8-12 ng/mL till Month 3 then 6-10 ng/mL; EVR: 3-8 ng/mL
| T Dumortier | Dose finding in immunology – transplantation | London December 2014
8
Case study: Efficacy results
Numerical superiority of EVR + Low TAC. But no information about efficacy contribution of EVR
Probability of first rejection event
Kaplan-Meier estimates
Probability of first event NS = non-significant 0.07- 0.10-
NS
Month 12 results
0.22-
?
| T Dumortier | Dose finding in immunology – transplantation | London December 2014
What is ‘placebo’ in a TDM context?
Putative ‘placebo’: same TAC exposure as in the EVR + Low TAC arm but no EVR exposure
9
Concentration over time
Concentration (ng/mL)
EVR + Low TAC
Time (Days since randomization)
Putative ‘Placebo’
Time (Days since randomization) Concentration (ng/mL)
| T Dumortier | Dose finding in immunology – transplantation | London December 2014
Solution – I
Adequate exposure data, possibility to use an exposure-response analysis to predict the putative ‘placebo’ efficacy
10
TAC Concentration over time TAC Concentration Density
| T Dumortier | Dose finding in immunology – transplantation | London December 2014
Solution - II
Using an adequate PK/PD methodology, A) a very significant TAC concentration effect was detected
11
Probability of rejection event by Month 12, by predicted TAC concentration
High TAC EVR + Low TAC Putative ‘placebo’ control (Low TAC)
| T Dumortier | Dose finding in immunology – transplantation | London December 2014
Solution - II
B) a very significant contribution of EVR to the efficacy of the combination was detected
12
Probability of rejection event by Month 12, by predicted TAC concentration
High TAC EVR + Low TAC Putative ‘placebo’ control (Low TAC)
P < 0.001
| T Dumortier | Dose finding in immunology – transplantation | London December 2014
Solution - II
- r C) a non-inferiority margin could be calculated for further non-inferiority
analysis
13
Probability of rejection event by Month 12, by predicted TAC concentration
High TAC EVR + Low TAC Putative ‘placebo’ control (Low TAC)
M1
| T Dumortier | Dose finding in immunology – transplantation | London December 2014
Impact
The modeling work has been key to the approval of the combination
- The modeling report (major amendment to the sNDA), triggered an
additional 90 day extension to the review
- Subsequent FDA’s Pharmacometric review:
- Similar approach + additional analyses
- Some differences in the interpretation
- Similar conclusions
- The sNDA was eventually approved, without requests for REMS or
post approval commitment study
- EVR + Low TAC is the first drug combination approved in liver
transplantation in 10 years
14 | T Dumortier | Dose finding in immunology – transplantation | London December 2014
Methodological aspects
- Several features specific to immunology/transplantation
had to be addressed
- Absence of placebo, or dose-response information
- Non steady-state exposure
- Sparse PK sampling
- Individual dose adjustments
- ... Addressed using
- A population PK model coupled with a time-to event model
- An assessment of causality of the exposure-response relationship
15 | T Dumortier | Dose finding in immunology – transplantation | London December 2014
Sparse PK sampling, non ‘steady state’ exposure
Requires a population PK analysis to provide a realistic approximation of the true (unknown) tacrolimus concentration
16
Example of one study subject :
| T Dumortier | Dose finding in immunology – transplantation | London December 2014
Non ‘steady state’ exposure
Requires a time-to event method to account for systematic decrease in exposure and time-varying baseline hazard
17
Predicted TAC exposure over time, and rejection event (High TAC arm)
Curve = predicted TAC concentration for one subject of the High TAC arm (N=245) Dot ( ) = predicted TAC concentration on Day of event (N=22 subjects)
| T Dumortier | Dose finding in immunology – transplantation | London December 2014
Non ‘steady state’ exposure
An E-R relationship appears when looking in a time-match fashion, in
- rder to account for time-varying baseline risk
18
Dots ( ) = predicted TAC concentration on each day with events (N=245 subjects), Box-plot = corresponding distribution Dots ( ) = predicted TAC concentration on Day of event (N=22 subjects)
Predicted TAC exposure at event days, and rejection event (High TAC arm)
| T Dumortier | Dose finding in immunology – transplantation | London December 2014
Individual dose adjustments
TAC concentration not randomized. This can cause a biased estimate
- f the exposure-response relationship
19
- There are baseline prognostic factors for rejection events
- The TAC concentration is not randomized
Investigators could target different levels depending on prognostic factor
- Not accounting for those factors result in biased inference
Tacrolimus concentration (ng/mL) Probability of event
High risk patients Low risk patients
| T Dumortier | Dose finding in immunology – transplantation | London December 2014
Tacrolimus concentration (ng/mL) Probability of event
High risk patients Low risk patients
Over-estimation Under-estimation
Individual dose adjustments
Presence of anti conservative bias must be ruled out; this was investigated by FDA’s Pharmacometrics group
- Overestimated E-R relationship
- not expected: investigators ‘assigning’ low concentration to patients at risk (based on
baseline prognostic factors)
- would result in overestimation the efficacy contribution of EVR Anti-conservative
- ABSOLUTELY NEED TO BE RULED OUT
20 | T Dumortier | Dose finding in immunology – transplantation | London December 2014
Tacrolimus concentration (ng/mL) Probability of event
High risk patients Low risk patients
Probability of rejection event by Month 12, by predicted TAC concentration
High TAC EVR + Low TAC Putative ‘placebo’ control (Low TAC)
Individual dose adjustments
No confounding factors resulting in relevant anti-conservative bias
- Presence of anticonservative bias was investigated by FDA’s pharmacometric
department for 3 potential prognostic factors:
- Diagnostic of “HCV positive”
- eGFR at randomization
- MMF use prior to randomization (Yes/No)
- Analysis method: includes the baseline prognostic factors as additional covariate in
the hazard model
- All analyses show conservative results (flatter exposure-response relationship
without covariate adjustment)
- Those sensitivity analyses led to a conservative estimate of M1, which was
used to interpret the primary efficacy analysis
21 | T Dumortier | Dose finding in immunology – transplantation | London December 2014
Conclusion
- A novel PMX based approach was used retrospectively to
support the regulatory submission of a new combination transplant therapy
- The method was able to provide evidence of efficacy of
the individual components of the treatment that could not have been done with traditional methods
- Support for the methodology within the Regulatory
Authority helped gain acceptance and approval
- The example demonstrates that there is significant room
for improvement in the application of dose finding methodologies
22 | T Dumortier | Dose finding in immunology – transplantation | London December 2014