
SLIDE 1
Harper Avenue Focus Area Open House Existing Conditions Existing - - PowerPoint PPT Presentation
Harper Avenue Focus Area Open House Existing Conditions Existing Development Existing Development Existing Development Existing Development Existing Development Existing Development Existing Development Existing Development Existing
Owner Occupied 39 Parcels 19% Auburn Owners 45 Parcels 21% Alabama Owners 36 Parcels 17% Out of State Owners 23 Parcels 11% Multi-Parcel Owners/Auburn 67 Parcels 32%
Harper Avenue Ownership
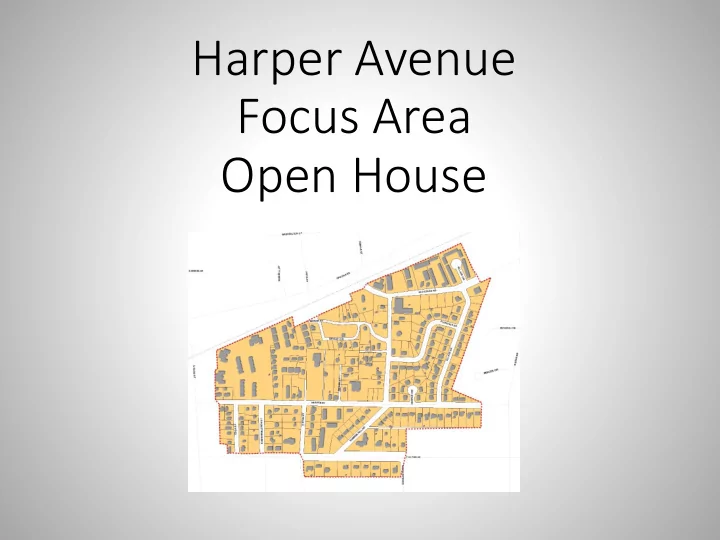
205 Parcels Total 86.50 Acres
13 8 7 6 5 4 4 3 3 3 3.76 2.04 1.90 0.94 2.33 1.24 1.76 1.30 0.60 0.51
2 4 6 8 10 12 14 FUCCI SPENCER COOK LIPSCOMB FAMILY LANIER JL VENTURES LLC WILLIAMS GLENN ROSS PROPERTIES LLC KAW HOLDINGS LLC LEUMAS COMPANY LLC
Parcel Ownership
Area # Parcels
29.2% 6.9% 61.1% 33.3% 20.0% 11.6% 14.3% 0.0% 18.1% 0.0% 10.0% 20.0% 30.0% 40.0% 50.0% 60.0% 70.0% NC-5 NC-12 RDD
Owner Occupied and Undeveloped
% total % Owner Occupied % Undeveloped
63 21 9 15 3 132 16 25 209 40 34
50 100 150 200 250 Parcels # Owner Occupied # Undeveloped
Parcels and Zoning
NC-5 NC-12 RDD Totals
4 11 17 21 22 2 1 1 2 11
5 10 15 20 25
RDD Zoned Area Number Units Built
948 1092 1009 1284 1432 819 1244 1064 1019 1035
200 400 600 800 1000 1200 1400 1600
RDD Zoned Area Aveage Area Sq. ft.
18 38 4 1
5 10 15 20 25 30 35 40
NC Zoned Areas Number Units Built
1471 1186 1497 1608
200 400 600 800 1000 1200 1400 1600 1800
NC Zoned Areas Average Area Sq. Ft.
$0.00 $50,000.00 $100,000.00 $150,000.00 $200,000.00 $250,000.00
Study Area Auburn
$130,682 $230,071
Median Home Value (2017)
0% 10% 20% 30% 40% 50% 60% 70% 80% 90% 100%
Owner Occupied Renter Occupied Vacant
11.9% 74.8% 9.2% 37.9% 52.8% 9.3%
Housing Tenancy (2017)
Study Area Auburn Study Area Auburn 0% 10% 20% 30% 40% 50% 60% 70% 80% 90% 100% Drove Alone Carpooled Walked Public Transit Biked 49% 16% 25% 6% 0% 79% 8% 5% 2% 7%
Mode of Transportation (2017)
Average price per square foot: $125 Average price per square foot: $96
Commercial, 18 Single-Unit , 134 Duplex, 21 Triplex, 1 Multi-Unit, 8 Government, 1 Religious, 1 Parking, 1 Vacant, 25
Exi Existin ing La Land nd Use
EXISTING
Name Description Area (ac)
Low-Medium Density Residential
Average density of six (6) dwelling units per acre. Permitted uses/development types include single-family detached, zero lot line, townhouse, duplex, and traditional neighborhood development. 38.96 (48.2%)
Medium-High Density Residential
Average density of eight (8) dwelling units per acre for medium-density (75% of area) and sixteen (16) du/ac for high- density (25% of area). Permitted uses include single family detached, zero lot line, townhouse, duplex, apartments, and traditional neighborhood development 14.26 (17.6%)
High-Density Residential
Maximum density of sixteen (16) dwelling units per acre. Permitted uses/development types all residential uses except manufactured homes. 1.85 (2.3%)
Mixed Use – Office/Residential
Allows office and residential uses as horizontal or vertical mixed-uses. Live-work units are encouraged. The average residential density is eight (8) dwelling units per acre, with an average breakdown of uses at 75% office/25% residential. 25.65 (31.7%)
Hypothetical Max Buildout: 457 DUs
PROPOSED
Name Description Area (ac)
Medium-High Density Residential
Average density of eight (8) dwelling units per acre for medium-density (75% of area) and sixteen (16) du/ac for high-density (25% of area). Permitted uses include single family detached, zero lot line, townhouse, duplex, apartments, and traditional neighborhood development 46.11 (57%)
Mixed Use 2
This category is intended to have more urban feel than the remainder of the corridor and appropriately transition downtown to the regional commercial center to the East. Uses are focused on retail and adaptive reuse of existing structures, where possible. Residential uses are permitted in integration with retail uses, albeit at a lower intensity than in the Neighborhood Centers. Mixed uses are permitted both horizontally and vertically, while vertical mixtures will tend to be more appropriate closer to downtown 21.54 (26.6%)
Low-Medium Density Residential
Average density of six (6) dwelling units per acre. Permitted uses/development types include single-family detached, zero lot line, townhouse, duplex, and traditional neighborhood development. 13.22 (16.3%)
Hypothetical Max Buildout: 756 DU’s (40%↑)
EXISTING
Hypothetical Max Buildout: 1060 DUs ZC Du/ac Residential Commercial Open Space Tenant Area (ac) Max Buildout
RDD
16 Single Family permitted by
conditional except Cottage Dev & Private Dorm. Conditional 30% 5 unrelated 61.5 (76%) 983 DU’s
NC-5
5,000 sq ft lots Single Family only None None “Familyl 14.65 (18.1%) 62 DU’s
NC-12
12,000 sq ft lots Single Family only None None “Family” 4.73 (5.9%) 15 DU’s
PROPOSED
ZC Du/ac Residential Commercial Open Space Tenant Area (ac) Max Buildout
DDH
5.5 Single Family permitted by
except Cottage Dev & Private Dorm. None 30% “Family” 13.22 (16.3%) 73 DU’s
CDD
9.5 Some performance residential permitted by
permitted by right. Private dormitory prohibited. Most commercial uses permitted 25% 5 unrelated 6.0 (6.9%) 57 DU’s
MD- DDH*
12 All performance residential uses are permitted by right, except for Multiple Unit Development, which is a conditional use. Private Dormitory prohibited. None 15% 5 unrelated 46 (56.9%) 552 DU’s
CRD-E*
10 All residential uses are permitted by right, except for Multiple Unit Development, which is a conditional use. Private Dormitory prohibited. Limited commercial 15% 5 unrelated 21.22 (26.6%) 216 DU’s
Hypothetical Max Buildout: 898 DU’s (15%↓)