
SLIDE 1
8 th & Gale Market Place 2645 8 th Avenue South, Nashville, TN - - PowerPoint PPT Presentation
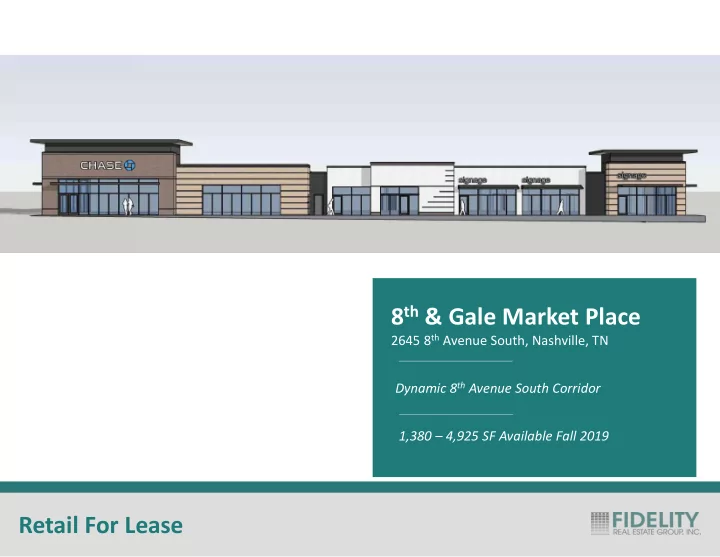
8 th & Gale Market Place 2645 8 th Avenue South, Nashville, TN Dynamic 8 th Avenue South Corridor 1,380 4,925 SF Available Fall 2019 Retail For Lease 8 th Avenue Elevation Parking Lot Elevation View from Gale Lane View from 8 th Avenue
C H A R L O T T E W E S T E N D M U R P H Y R D E STES RD 1 2 T H A V E S F R A N K L I N P I K E 1 7 T H B E L M O N T 4 T H A V E S A B B O T T M A R T I N H I L L S B O R O P I K E H A R D I N G P L
40
440
65
The Property
The Smiling Elephant
Octave 321 Units IMT 8 South 330 Units Eighth South 52 Units 23Hundred @ Berry Hill 266 Units Gale Lofts 95 Units The Melrose Phase II 138 Units The Melrose Phase I 220 Units
The Property
1 2 3 4 5 6 7 8 9
Retailers
1 8th & Gale Market Place 2 Kroger 3 Jimmy Johns 4 Chick-fil-a 5 Walgreens 6 Mapco 7 McDonalds 8 Regions 9 Dollar Tree 10 M.L. Rose 11 Sutler 12 Fenwick’s 13 Sinema 14 NTB 15 Sherwin Williams 16 Xfinity 17 SunTrust 18 Sonic 19 Holler & Dash 20 Cilantro 21 Smiling Elephant 22 Hattie B’s 23 Urban Juicer 24 Shell 25 Burger King 26 8th & Roast 27 Subway 28 Exxon
Multifamily
1 Gale Lofts – 95 Units 2 The Melrose II – 138 Units 3 The Melrose I – 220 Units 4 Eighth South – 52 Units 5 IMT 8 South – 330 Units 6 Octave – 321 Units 7 23Hundred at Berry Hill – 266 Units 10 11 12 13 17 16 15 14 18 19 20 26 22 21 23 24 25 27 28 6 4 3 5 2 1 1 7
1 MILE RADIUS 3 MILE RADIUS 5 MILE RADIUS
2010 Population 7,217 77,724 200,927 2017 Population 8,913 87,517 223,428 2022 Population 9,937 93,529 237,935 2010-2017 Population Change 2.95% 1.65% 1.47% 2017-2022 Population Change 2.20% 1.34% 1.27% 2017 Median Age 36.4 31.8 33.2 2010 Households 3,679 32,994 83,729 2017 Total Households 4,508 37,835 93,019 2022 Total Households 5,008 40,890 99,328 2010-2017 HH Change 2.84% 1.91% 1.46% 2017-2022 HH Change 2.13% 1.57% 1.32% 2017 Average Household Size 2.0 2.0 2.2 2017 Median Household Income $52,401 $49,461 $45,207 2017 Average Household Income $81,688 $83,476 $78,776 2017 Per Capita Income $40,829 $38,416 $34,353 2017 Total Housing Units 4,897 42,062 103,083 2017 Owner Occupied Housing Units 2,354 15,561 39,367 2017 Renter Occupied Housing Units 2,155 22,274 53,653 2017 Vacant Housing Units 389 4,227 10,064 2022 Total Housing Units 5,441 45,343 109,917 2022 Owner Occupied Housing Units 2,580 16,700 41,691 2022 Renter Occupied Housing Units 2,428 24,189 57,637 2022 Vacant Housing Units 433 4,453 10,589
POPULATION