
SLIDE 1
Growth, Structural Transformation, and Rural Change in Vietnam
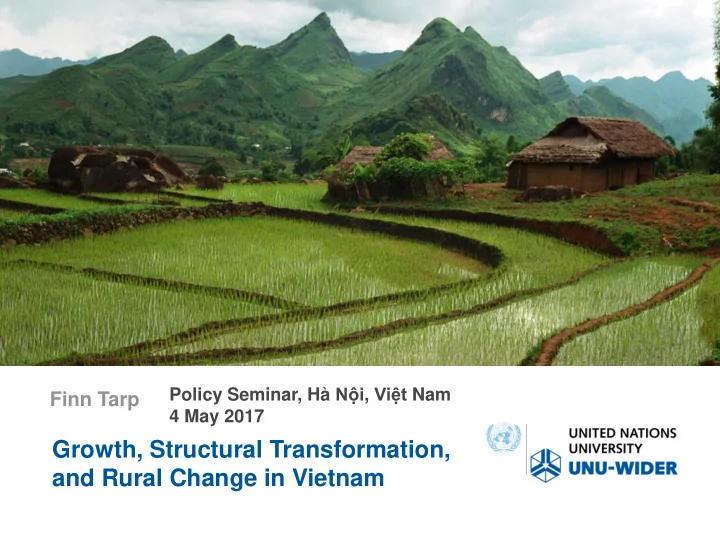
Finn Tarp
Policy Seminar, Hà Nội, Việt Nam 4 May 2017
Growth, Structural Transformation, and Rural Change in Vietnam - - PowerPoint PPT Presentation
Policy Seminar, H Ni , Vit Nam Finn Tarp 4 May 2017 Growth, Structural Transformation, and Rural Change in Vietnam Vietnam Access to Resources Household Survey: VARHS 2006-2014 VARHS origin dates back to 2002 (started with support
Policy Seminar, Hà Nội, Việt Nam 4 May 2017
Chapter 1: Setting the Scene Chapter 2: Characteristics of the VARHS Data and Other Data Sources Part I: A Rural Economy in Transformation Chapter 3: Local Transformation: A Commune Level Analysis Chapter 4: Commercialization in Agriculture Chapter 5: The Rural Non-farm Economy Part II: Key Production Factors and Institutions Chapter 6: Land Issues: Land and Land Markets Chapter 7: Labour and Migration Chapter 8: Information and Communication Technology Chapter 9: Social and Political Capital Part III: Welfare Outcomes and Distributional Issues Chapter 10: Welfare Dynamics Chapter 10: Gender Inequality and the Empowerment of Women Chapter 11: Children and youth Chapter 12: Ethnicity Disadvantage: Evidence Using Panel Data Chapter 13: Lessons and Policy
2 4 6 8 10 12 1985 1986 1987 1988 1989 1990 1991 1992 1993 1994 1995 1996 1997 1998 1999 2000 2001 2002 2003 2004 2005 2006 2007 2008 2009 2010 2011 2012 2013
Percent Year
1000 2000 3000 4000 5000 6000 7000 8000 Cambodia China Indonesia Lao PDR Malaysia Philippines Thailand Vietnam
Constant 2005 USD
2000 2013
5 10 15 20 25 30 35 40 45 50 19851986198719881989199019911992199319941995199619971998199920002001200220032004200520062007200820092010201120122013
Percent of total GDP Year
Agriculture Industry Services
200 400 600 800 1000 1200 2006 2007 2008 2009 2010 2011 2012 2013 Thailand China Vietnam Cambodia Indonesia
2 4 6 8 10 12 14 16 2006 2007 2008 2009 2010 2011 2012 2013 Thailand China Vietnam Cambodia Indonesia
2 4 6 8 10 12 2006 2007 2008 2009 2010 2011 2012 2013 Thailand China Vietnam Cambodia Indonesia
5 7 9 11 13 15 17 19 2006 2007 2008 2009 2010 2011 2012 2013 Thailand China Vietnam Cambodia Indonesia
– 1986: 400; 1996: 800; 2006: 1,600; 2016: 3,200 – 1986: 800; 1996: 1,600; 2006: 3,200; 2016: 6,400 – 1986: 1,600; 1996: 3,200; 2006: 6,400; 2016: 12,800
– A cancer can threaten structure and wellbeing of human body, and even its life if proper care and treatment not initiated in time; in socio-economic contexts similar dangers exist if corruption and societal values allowed to degrade, leading to institutional decay and a vicious circle that undermines development