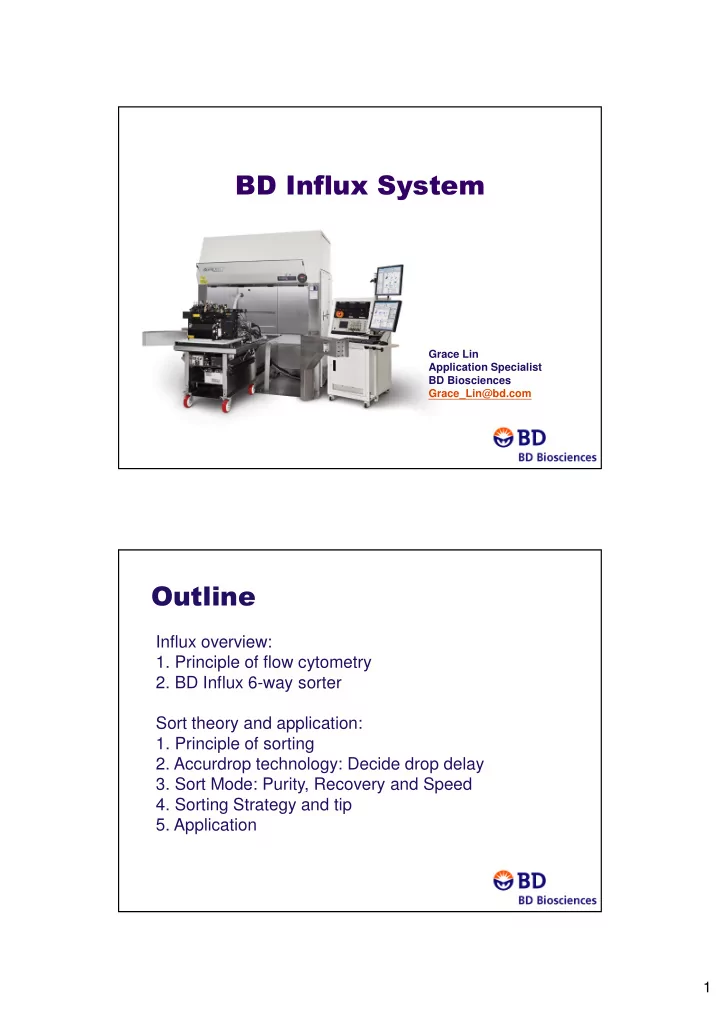
Grace Lin Application Specialist BD Biosciences - - PDF document

grace lin application specialist bd biosciences grace lin
SMART_READER_LITE
LIVE PREVIEW

Grace Lin Application Specialist BD Biosciences - - PDF document

Grace Lin Application Specialist BD Biosciences Grace_Lin@bd.com Influx overview: 1. Principle of flow cytometry 2. BD Influx 6-way sorter Sort theory and application:


slide-1
SLIDE 1

1

  • Grace Lin

Application Specialist BD Biosciences Grace_Lin@bd.com

Influx overview:

  • 1. Principle of flow cytometry
  • 2. BD Influx 6-way sorter

Sort theory and application:

  • 1. Principle of sorting
  • 2. Accurdrop technology: Decide drop delay
  • 3. Sort Mode: Purity, Recovery and Speed
  • 4. Sorting Strategy and tip
  • 5. Application
slide-2
SLIDE 2

2

  • Flow = Fluid
  • Cyto = Cell
  • Metry = Measurement
  • A variety of measurements are made on cells, cell
  • rganelles, and other objects suspended in a liquid

and flowing at rates of several thousands per second through a flow chamber.

  • Fluidics

Optics Electronics Software

slide-3
SLIDE 3

3

  • Per CP

FITC

90° ° ° °

FSC SSC & FL SYSTEM ELECTRONICS

  • Fluidics

To introduce and focus the cells for interrogation and create a stable breakoff for sorting

Optics

To generate and collect the light signals

Electronics

To convert the optical signals to proportional digital signals, process the signals, and communicate with the computer

slide-4
SLIDE 4

4

  • WASTE

SHEATH

sheath filter

VACUUM OUT AIR IN V

flush bucket stream drain nozzle sample line sheath line backflush drain

AIR IN V V

purge line

  • Fluorescent light
  • Scatter light
slide-5
SLIDE 5

5

sample flow sheath flow laser beams sheath flow sample flow sheath flow laser beams sheath flow low differential pressure high differential pressure

  • Fluidics

To introduce and focus the cells for interrogation and create a stable breakoff for sorting

Optics

To generate and collect the light signals

Electronics

To convert the optical signals to proportional digital signals, process the signals, and communicate with the computer

slide-6
SLIDE 6

6

!"

SSC FSC

Internal Complexity Granularity Size Shape Surface Refractive index

Cell Line

Cell debris Major Cell population

!""

Forward Scatter Side Scatter

slide-7
SLIDE 7

7

12 to 14 µm Monocyte 10 to 14 µm Neutrophil

8 to 10 µm Lymphocyte

Threshold Debrise

!""

Peripheral blood

!"

Fluorescence

slide-8
SLIDE 8

8

!" # $$

633

Excitation: Which laser can generate signals Emission: Which detector to collect signals

slide-9
SLIDE 9

9

##%$

  • bjective

collimating lens pinhole = spatial filter nozzle & stream chromatic filter detector

slide-10
SLIDE 10

10

&

  • 488-nm, 4-color mirror block (example)

460 500 540 460 500 540 LP 500 BP500/50

Shortpass Longpass Bandpass

460 500 540 SP 500

BP500/50= 500±25 =475-525nm

slide-11
SLIDE 11

11

"

Excitation laser Detection Range Example Fluorochrome

488 Blue laser (200mW) 530/40 FITC 580/30 PE 610/70 PE-TR 682/40 PerCP-Cy5.5 750LP PE-Cy7 405 Violet laser (100mW) 425/26 BV421 520/35 BV500 610/20 BV605 660/20 BV650 710/50 BV711 780/60 BV786 640 Red Laser (120mW) 670/30 APC 720/40 APC-Alexa700 750LP APC-Cy7

3 lasers-14 color system (5B-6V-3R)

  • Fluidics

To introduce and focus the cells for interrogation and create a stable breakoff for sorting

Optics

To generate and collect the light signals

Electronics

To convert the optical signals to proportional digital signals, process the signals, and communicate with the computer

slide-12
SLIDE 12

12

$

BD Sortware Client Computer Instrument Interface Server BD Influx Instrument Electronics

Per CP FITC

$

Detector (PMT) Amplifier (Linear or Log) Processing

slide-13
SLIDE 13

13

'(")

Time (µ Seconds) Volts Pulse Area (Integration)

Pulse Height Pulse Width

!!"%

slide-14
SLIDE 14

14

*#

Purify target cell or particle population into various device With different choice of nozzle size 70µm, 86µm, 100µm, 140µm, 200µm (optional) Collection device: 5ml tube, 15ml tube, 50ml tube 96 well, 384 well, slide, customized device Sort Mode: 2 way, 4 way, 6 way, single cell, index sorting Optional: BSC, AMO, temperature control

slide-15
SLIDE 15

15

"

1. Pass cells through the laser one at a time 2. Collect and analyze signals from each cell to determine which cells to sort 3. Charge the stream as the droplet containing a target cell breaks off 4. Deflect the charged droplet into the appropriate collection tube or device 5. Allow uncharged droplets to pass to waste

+ –

+ + – – – + –

Oscillating Voltage Piezo Disc Acoustic Wave

Wave Becomes Drops Break off

Nozzle Size:

70µm, 86µm, 100µm, 140µm, 200µm

slide-16
SLIDE 16

16

)+,

Optimal pressure frequency

20 40 60 80 100 120 10 20 30 40 50 60 70 80 Pressure (psi) Frequency (kHz) 70 micron nozzle 100 micron 140 micron 200 micron

Recommended pressure/frequency combinations

  • ..+)+,"

Nozzle size Pressure(psi) Frequency (kHz)

70 35 ~75-76 70 40 ~80 70 52 ~86.8 70 60 ~99.2 70 65 ~98.2 86 25 ~50 86 30 ~48 86 33 ~58 86 40 ~65 100 10 ~36 100 16 ~29.2 100 17-18 ~27 100 20 ~37 100 20 ~39 100 24 ~39.00 100 27 39.2 100 27 45.6 100 32 ~48.6 140 5 ~13.9 200 2.8 ~6.2

slide-17
SLIDE 17

17

""

+ +

BD FACS™ Accudrop technology

  • Accudrop beads
  • Diode laser
  • Camera
  • Optical filter

drop delay

charge electrode

breakoff Diode laser

slide-18
SLIDE 18

18

"% %

  • When drop delay is set correctly, Accudrop beads will be

depleted from center stream.

  • Use the Accudrop filter so that only the beads show in the

stream camera.

Neutral Density Filter Accudrop Filter

%

Correct Drop Delay

slide-19
SLIDE 19

19 Accudrop Optical Filter on

Not Correct Drop Delay Accudrop beads still in the center stream Correct Drop Delay Accudrop beads all in deflected side stream

/

slide-20
SLIDE 20

20 Extra Coincidence Objective Drops Setting Adjust how much phase into adjacent drops to abort due to non- target cells Enrich (no coincidence) Purify (coincidence with override) Single (coincidence no override) Sort an additional drop if the cell is

  • n edge of drop

Result Phase Mask Current Drop Will only sort if cell is in designated portion of droplet

Number of Drops

Sort 1 drop

1.0-drop setting

  • Sort 1 drop, regardless of the cell’s position within the drop.
  • There’s a chance that cell is actually in other drops.

Sort 1 drop Sort 1 drop

slide-21
SLIDE 21

21

Sort 1 drop Sort 2 drops Sort 2 drops

1.5-drop setting (50%x1 drop+50%x 2 drop=1.5 drop)

  • If the cell is in the center of the drop, sort 1 drop.
  • If the cell is at the edge of the drop, sort 2 drops.
  • You could get more accurate cell count compare to 1.0 drop

1.5 drop is equivalent to Yield mask of 16 on the Aria.

The Objective setting influences sort purity and sort efficiency.

  • Enrich. Disables all coincidence. Sort as much as you

can, for rare cell population

  • Purify. Enables coincidence and coincidence override

(2 target cells in same drop or within the extra coincidence zone).

  • Single. Enables coincidence and disables coincidence
  • verride to ensure that only one target event can be
  • sorted. (single cell sorting for plate)
slide-22
SLIDE 22

22

$"

Enrich On

sort sort

Enrich Off (Ex: Purify)

Get 1 target cell Also 1 non-target cell No cell was sorted

/

Sort Mode Settings When to use

1.0 Drop Yield 1-drop sort 1.0 Drop Coincidence No phase gate If you need to get the highest combination of purity and yield 1.5 Drop Pure 1.5-drop sort 1.5/2.5 Drop Coincidence No phase gate If you need an exact count and high purity 2.0 Drop Enrich 2-drop sort No Coincidence No phase gate If the recovery of target cells is more important than purity 1.0 Drop Single 1-drop sort 1.5 Drop Coincidence 10/16 Drop Phase Mask If you need to sort large or sticky cells and need an exact count If you need to sort single cells into plate wells

slide-23
SLIDE 23

23

"1

)

  • Depends on what you want:

–Purity –Recovery –Yield –Viability

Speed !!

slide-24
SLIDE 24

24

) 1 ,

high frequency low frequency more empty drops Greater chance of coincidence

same event rate, higher frequency will have higher efficiency and recovery

slide-25
SLIDE 25

25

high event rate low event rate

1 $2

Same Frequency, lower events rate will give you higher recovery but will consume more time

more empty drops Example:39.0KHz/s

)

  • Enrich rare cell population if possible
  • Avoid cell clumps

– Always filter your cells before sort! – Use Accutase instead of Trypsin – Treat cells with DNAse

  • Use appropriate sample buffer

– PBS, HBSS or phenol-red free culture media w/ 25mM HEPES, 5mM EDTA and 1~2% FBS or 0.1~0.2% BSA to maintain cell viability

  • Use viability dye to confirm cell viability before sort
slide-26
SLIDE 26

26

3"

  • Collection tube:

Pre-coated with 1% BSA or 10% FBS overnight and filled with appropriate collection buffer

– 5ml Falcon tube: 2ml – 15ml centrifuge tube: 7ml

  • Change collection tubes periodically
  • Temperature control
  • Event (Threshold) rate:

1/10~1/4 drop drive frequency for better yield

1

slide-27
SLIDE 27

27

Emission Spectra: Spectral Overlap

APC PerCP PI

Wavelength (nm) 400 500 600 700 100% 0%

Pacific Blue

Normalized Intensity

FITC PE AmCyan PerCP-Cy5.5

800

PE-Cy7 FITC PE PerCP-Cy5.5

650 700 PerCP-Cy5.5 695/40 500 600 FITC 530/30

Relative Intensity Wavelength (nm)

550 PE 585/42

PE-Cy7

PE-Cy7 780/60 750 800

slide-28
SLIDE 28

28

1

650 700 PerCP-Cy5.5 695/40 500 600 FITC 530/30

Relative Intensity Wavelength (nm)

550 PE 585/42 750 650 700 PerCP-Cy5.5 695/40 500 600 FITC 530/30

Relative Intensity Wavelength (nm)

550 PE 585/42

1

slide-29
SLIDE 29

29

650 700 PerCP-Cy5.5 695/40 500 600 FITC 530/30

Relative Intensity Wavelength (nm)

550 PE 585/42

1

Compensation Matrix

slide-30
SLIDE 30

30

$

Correct Compensation Undercompensation Overcompensation Incorrect Compensation

%

  • Sort different target cell
  • Life or death
  • Morphology
  • Surface antigens
  • Gene expression.
  • Cell functions.
  • DNA content
slide-31
SLIDE 31

31

Sorting Cells By Surface Markers

  • Sorting NK Cells

–CD3 FITC to exclude T cells –CD56+CD16 PE to include all NK Cells.

R1

R3

R2

分選前的分析 分選後結果

Sorting NK Cells for Cytotoxicitity Studies

slide-32
SLIDE 32

32

Regulatory T Cell Sorting CD4/CD25 Treg sorting

CD4 PerCP CD25PE

1.35 % 8.94 % Sort on R1 and R2 sort on R1 and R3

slide-33
SLIDE 33

33

CD4/CD25 High/CD127 Lo Sorting by Gene Expression

Add viability check. R2

slide-34
SLIDE 34

34

Sorting by Gene Expression Sorting by Gene Expression

slide-35
SLIDE 35

35

  • Rare cell sorting usually requires pre-enrichment steps:

– Bring the starting purity to > 5 % – Ficoll – Immune Panning – Magnetic Beads (Positive/Negative)

Rare Cell Sorting tip

Rare Cell Sorting

slide-36
SLIDE 36

36

Stem cell sorting Hematopoietic Stem Cells

slide-37
SLIDE 37

37

Bone Marrow Stem Cell

After Sorting

LSK 97%

Before Sorting

LSK 0.7% C-Kit Lin- Sca-1 C-Kit

Thank You