GENERATING 3D FRUIT MAPS FOR MODEL-BASED ASSESSMENT OF - - PowerPoint PPT Presentation

generating 3d fruit maps for model based assessment of
SMART_READER_LITE
LIVE PREVIEW

GENERATING 3D FRUIT MAPS FOR MODEL-BASED ASSESSMENT OF - - PowerPoint PPT Presentation

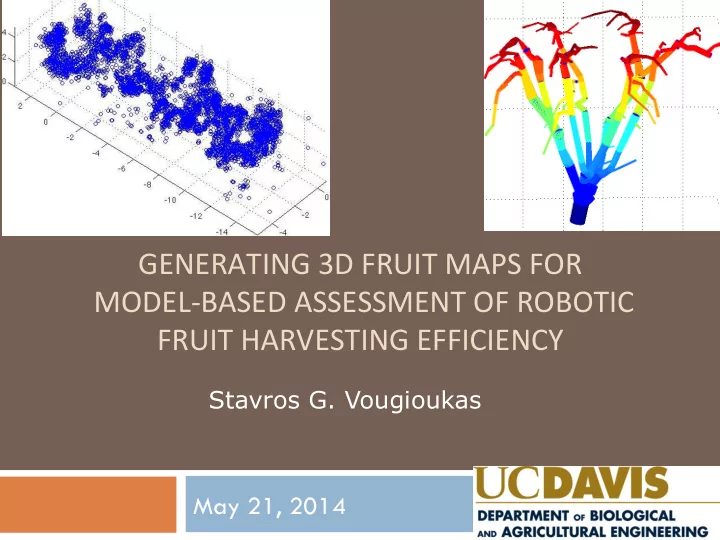
GENERATING 3D FRUIT MAPS FOR MODEL-BASED ASSESSMENT OF ROBOTIC FRUIT HARVESTING EFFICIENCY Stavros G. Vougioukas May 21, 2014 Motivation 3 Question No. 1 4 Can we build


slide-1
SLIDE 1

GENERATING ¡3D ¡FRUIT ¡MAPS ¡FOR ¡ ¡MODEL-­‑BASED ¡ASSESSMENT ¡OF ¡ROBOTIC ¡ ¡ FRUIT ¡HARVESTING ¡EFFICIENCY ¡

May 21, 2014

Stavros G. Vougioukas

slide-2
SLIDE 2

Motivation

3

slide-3
SLIDE 3

Question No. 1

¨ Can we build cost-effective fruit harvesting

machines for existing tree architectures?

4

slide-4
SLIDE 4

Question No. 2 ¡

¨ How much do different training systems affect

mechanized harvesting efficiency? ¡

5

slide-5
SLIDE 5

Work-cell automation ¡

6

STEP 1 STEP 2

slide-6
SLIDE 6

Orchard harvest mechanization ¡

7

¨ Directly to Step 2: Design, build, evaluate…

1968 2008

slide-7
SLIDE 7

Orchard harvest mechanization

8

2012 1985

¨ Directly to Step 2: Design, build, evaluate…

slide-8
SLIDE 8

Limitations of existing approach ¡

¨ Development cycle : (Re)design, build, evaluate ¡

9

Re-design platform ¡ Build ¡ Experiment ¡ Evaluate ¡

¤ Since early on, the cycle relies on field testing ¤ Costly & slow (~1 cycle/year). ¤ Funding eventually runs out… ¡

slide-9
SLIDE 9

…more limitations ¡

10

¨ Experimental evaluations are not readily

transferable:

Machines ¡ Training systems & orchard layouts

slide-10
SLIDE 10

Model-based design ¡

11

Re-design ¡ Build ¡ Experiment ¡ Evaluate ¡ Re-design Machine &

  • rchard ¡
slide-11
SLIDE 11

‘Digital harvesting’ ¡

12

Design tool ¡ ¡ ¡ ¡

Machine kinematics Tree training system &

  • rchard layout

Worker/robot kinematics 3D fruit distributions

slide-12
SLIDE 12

Estimate 3D fruit distributions

13

( , , ) f h ρ ϕ

h ρ φ

slide-13
SLIDE 13

Measuring fruit locations on trees ¡

¨ Very few attempts documented

¤ 1966: Citrus; Schertz & Brown ¤ 2006: Citrus; Lee & Rosa

n String & plumb bob

¤ 1991: Citrus; Edan et al.

n Manipulator & inverse kinematics

¤ 1994: Kiwi; Smith et al.

n Surveying with theodolite ¨ Measurement rates < 1fruit/minute. ¡

14

slide-14
SLIDE 14

New approach ¡

15

¨ Track picker’s hand position when fruit is

grasped using ranging devices & trilaterate

¨ RCM400 from TimeDomain

¤ Center frequency: 4.3 GHz; Range: ~ 125 m (410 ft).

slide-15
SLIDE 15

16

Methodology

16

( )

( )

4 * * * 2 2 2 2 , , 1

ˆ ( , , ) argmin ( ) ( ) ( )

j j j

j j j ij j i j i j i x y z i

x y z r x bx y by z bz

=

= − − + − + −

slide-16
SLIDE 16

RCM accuracy in free space

17

Range error is < 6.5 cm (95% confidence)

slide-17
SLIDE 17

RCM accuracy in foliage

18

Range error is < 9.5 cm (95% confidence)

slide-18
SLIDE 18

Trilateration errors

¨ Geometric Dilution of

Precision (GDOP).

19

95th percentile (left) and mean (right) error in the fruit picking workspace. Trailer

slide-19
SLIDE 19

Experimental results

20

slide-20
SLIDE 20

Example: Bartlett Pears

21

slide-21
SLIDE 21

Open-vase Bartlett pear trees

22

slide-22
SLIDE 22

Pear yield distribution

23

Total: 7737 Average: 516 fruits per tree. Standard deviation, σ = 92.6 fruits.

slide-23
SLIDE 23

Pear angular distribution

24

max max

( ) ( , , )

H h

a f h d dh

ρ ρ

ϕ ρ ϕ ρ α

= =

= ≈

∫ ∫

( , , ) ( , )

d

f h f h ρ ϕ α ρ ≈

slide-24
SLIDE 24

Pear radial vs. height distribution

25

( , )

d

f h ρ

(m) (m)

slide-25
SLIDE 25

Pear height distribution ¡

26

max

2

( ) ( , , ) H h f h d d

ρ π ϕ ρ

ρ ϕ ρ ϕ

= =

= ∫ ∫

(m)

slide-26
SLIDE 26

Pear radial distribution

27

max

2

( ) ( , , )

H h

r f h d dh

π ϕ

ρ ρ ϕ ϕ

= =

= ∫ ∫

(m)

slide-27
SLIDE 27

High-density cling-peach trees ¡

28

slide-28
SLIDE 28

High-density cling-peach trees ¡

29

(ft) (ft)

slide-29
SLIDE 29

High-density cling-peach trees

30

Distance of fruits from trunk axis

(ft)

slide-30
SLIDE 30

High-density cling-peach trees

31

(ft)

slide-31
SLIDE 31

Work in progress: Tree digitization and modeling

32

slide-32
SLIDE 32

Next steps

¨ Integration of

tree models and fruits.

33

slide-33
SLIDE 33

Virtual fruit tree harvesting

How can we use this?

34

slide-34
SLIDE 34

Performance analysis and design ¡

35

¨ Picking efficiency; ¨ Picking throughput.

slide-35
SLIDE 35

Harvesting simulations: Open-vase trees

q Robotic picking at high speeds will be difficult; q Arms with reach of 8-10 ft would be too massive to be fast

enough; severe branch interference;

q Simulator will explore alternative multi-arm designs.

36

slide-36
SLIDE 36

Harvesting simulations: High-density trees

¨ Robot arms with reach of ~ 3ft can be fast

(~ 1 reach-retrieve/s).

37

slide-37
SLIDE 37

Design Issues

¤ Could actuator arrays achieve

high picking efficiency and speed?

¤ How many arms (~ $30k/arm)? ¤ What configuration? ¤ What sizes/work envelopes? ¤ How much do branches interfere?

38

slide-38
SLIDE 38

Machine design ¡ Build ¡ Field Testing ¡ Physical machine ¡ Breeding ¡ Cultivation/ training ¡ Physical plants ¡ Model ¡ Virtual Machine ¡

  • Functional-structural

plant models.

What could the future bring?

slide-39
SLIDE 39

THANK YOU! ¡

svougioukas@ucdavis.edu ¡

40

Acknowledgements: ¡ ¡ Ø Co-­‑Pis ¡

  • David ¡Slaughter ¡
  • Fadi ¡Fathallah ¡

Ø Numerous ¡California ¡growers. ¡ ¡ Ø Farm ¡advisors: ¡

  • Rachel ¡Elkins, ¡UCANR ¡Extension, ¡ ¡Lake ¡and ¡Mendocino ¡CounFes ¡
  • Roger ¡Duncan, ¡UCANR ¡Extension, ¡Stanislaus ¡County ¡
  • Janine ¡Hasey, ¡UC ¡Extension, ¡SuJer ¡& ¡Yuba ¡CounFes ¡
  • Chuck ¡Ingels, ¡UCANR ¡Extension, ¡Sacramento ¡County ¡

¡ Ø Students: ¡ Ø Jason ¡Wong, ¡Farangis ¡Khosro ¡Anjom, ¡Raj ¡Rajkishan. ¡ ¡