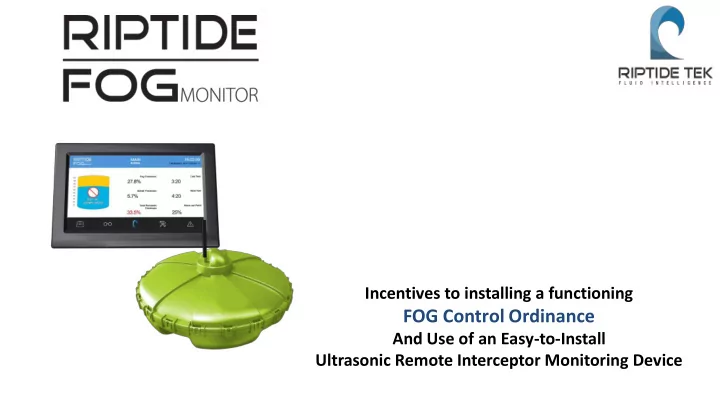
SLIDE 1
Incentives to installing a functioning
FOG Control Ordinance
And Use of an Easy-to-Install Ultrasonic Remote Interceptor Monitoring Device
SLIDE 2 FOG Problems
Business/Loss of Profits
- Immediate financial burden
- Business closures
- Construction moratoriums
- Heavy fines
Environment & Health
- Sanitary Sewer Overflows
- Substantial health risk to public
- Damage to environment
Operational & Infrastructure
- Strain on Materials & Resources:
- Increased expenditures to repair
and replace
- Increased cost of personnel to
manage and maintain
SLIDE 3
EPA Consent Decree, SSOs and CSOs
SLIDE 4 The Ordinance – Steps in Achieving Control
- Identify the FOG generators and effluent quantities
- Regulate the discharge method
- Introduce and enforce control devices (GDO)
- Regulate and enforce proper usage of the control devices
- Offer incentives; positive and negative
- evaluate effluent limits => test methods can be unreliable (100 vrs 150 mg/L)
- Offer guidance => establish Best Management Practices
- Increase inspection and enforcement procedures, incl. fines and business
closures
- Specify control device usage AND control device monitoring + maintenance
- Prolong maintenance intervals if control device used properly
SLIDE 5
- Identify the FOG generators and quantities
- Hot Spots and cost identification
The Ordinance – Steps in Achieving Control
Example: Miami-Dade County
SLIDE 6 The Ordinance – Steps in Achieving Control
Example: Miami-Dade County
- Regulate the Discharge Method
- Co-ordinate with all involved parties right from the start
SLIDE 7 The Ordinance – Steps in Achieving Control
Example: Miami-Dade County
- Regulate the Discharge Method
- Install and Operate the proper Control Device
SLIDE 8 The Ordinance – Steps in Achieving Control
Example: Miami-Dade County
- Regulate the Discharge Method
- Install and Operate the proper Control Device
SLIDE 9 The Ordinance – Steps in Achieving Control
Example: Miami-Dade County
Discharge Method
sized control devices
SLIDE 10 The Ordinance – Steps in Achieving Control
Example: Miami-Dade County
- Regulate the Discharge Method
- Regulate and enforce proper usage of the Control Device
1. Liquid Waste Haulers must have valid operating permits issued by MDC 2. Monthly reports by the FSE on pump-outs must be filed by the liquid waste hauler 3. Monthly reports must be kept on file by the FSE 4. Mandate cleaning cycle of the control devices 1. Gravity => every 60 days latest, or prior to 25% of operating capacity 2. Hydromechanical => every 30 days latest, or prior to 25% of operating capacity
SLIDE 11 The Ordinance – Steps in Achieving Control
Example: Miami-Dade County
- Offer Incentives
- Higher FOG discharge threshold
SLIDE 12 The Ordinance – Steps in Achieving Control
- Offer Incentives
- Offer Guidance by establishing
a base line for kitchen management to implement
SLIDE 13 The Ordinance – Steps in Achieving Control
Example: Miami-Dade County
- Mandate Interceptor Monitoring Device to ensure proper maintenance
- FSEs physically separated from their interceptor require a monitoring device
SLIDE 14 The Ordinance – Steps in Achieving Control
- Offer Positive Incentives
- Financial incentive => potential
to save pump-out cost if proof that control devices properly maintained
SLIDE 15 The Ordinance – Steps in Achieving Control
- Offer Incentives
- Financial incentive => potential to save pump-out cost if proof that control
devices properly maintained
- Extends pump-out periods up to 180 days
SLIDE 16 The Ordinance – Steps in Achieving Control
Example: Miami-Dade County
- Offer Negative Incentives
- Increase inspection, enforce procedures and compliance
- Educate, and if necessary enforce
- Criminal and Civil Action (last step, but possible)
SLIDE 17 The Ordinance – Steps in Achieving Control
- Offer Negative Incentives
- Threaten imposed monitoring
if proof that control devices not properly maintained 14.6. Where a discharger fails to adequately maintain the oil and grease interceptor to the satisfaction of the Region, the Region may require an alarmed monitoring device
- r such other device to be installed at the site, which the discharger shall then install
at its expense, in accordance with specifications of CAN/CSA B481, as amended from time to time The Regional Municipality of York Discharge of Sewage, Storm Water and Land Drainage Bylaw BILL NO.56 BYLAW NO.2011-56
SLIDE 18
How Interceptor Monitoring Helps
Data
The gathered facts
Knowledge
Our collective view of data and information
Decisions
The best informed actions we can take
Information
Captured Data & Knowledge
SLIDE 19
Interceptor Monitoring Device (IMD) - Regulatory
In the event the grease interceptor is located remote from the FSE, e.g. more than 100 feet horizontal distance away, or on another floor, the use of an IMD is mandated to ensure proper knowledge of grease levels.
SLIDE 20 Interceptor Monitoring Device (IMD) - Financial
The cost of pumping out gravity grease interceptors varies on a number of factors depending on size of the interceptor, quantity of interceptors, location of individual sites, frequency of pump-
- uts, contractual negotiations (e.g. multiple sites).
In general, an average pump-out will cost approx. USD 0.25 per gallon plus the transport charge. With pump-outs mandated at 60 days at the latest, and assuming a flat rate of e.g. $50 per transport, this translates to:
Without IMD With IMD
750 gallon => $1,425.00 per year => $475.00 p.a. 1250 gallon => $2.175.00 per year => $725.00 p.a. 1500 gallon (two interceptors) => $2,550.00 per year => $850.00 p.a. 2500 gallon (2-3 interceptors) => $4,050.00 per year => $1,350.00 p.a. 5000 gallon (quite a few interceptors) => $7,800.00 per year
SLIDE 21 Remote Ultrasonic Monitoring - FOGMonitor
Communicating, displaying, logging and reporting the data
- Wireless transmission of the data through RF
technology
- The data is wirelessly transmitted to the
control display allow the user to see the content levels
- When the FOG volume reaches a pre-set
amount a warning alerts the user indicating that a pump-out is required
- Logging capabilities allow for historical
analysis, as well as report generation
SLIDE 22
- Quick & Easy Install – essentially plug & play
- Single mounting point for communications box
- Durable and reliable float sensor
- Wireless transmission, no external power source required for
sensor
- Logging function, allows for ease-of-reporting
Remote Ultrasonic Monitoring - FOGMonitor
SLIDE 23 Example files from field trial Riptide Tek system in a restaurant in London, Ontario
Daily Measurements over a week. Measured every 24 hours Date Measured Beaker 11/19/2015 63 11/20/2015 68 65 11/21/2015 70 11/22/2015 78 11/23/2015 83 11/24/2015 88 11/25/2015 87.5 11/26/2015 90 11/30/2015 92 95 12/14/2015 129 125 1/18/2016 88 85 1/19/2016 84 1/20/2016 88 1/21/2016 88 1/22/2016 87 1/23/2016 88 1/24/2016 91 1/25/2016 94
Remote Ultrasonic Monitoring - FOGMonitor
SLIDE 24 Decision Time – Analyzing the Data
Compliance doesn’t automatically mean compliance.
An interceptor remaining under 25% operating capacity may still be discharging FOG into the sewer lines. An interceptor in excess of the 25% FOG rule may not be discharging any FOG at all. Knowing the individual levels in conjunction with Best Management Practices is key in streamlining effluent handling.
- Better Regulatory Compliance
- Lower Operating Costs
SLIDE 25
Best Outcome
Regulatory Compliance => more effective use of resources, both in manpower and equipment cost Cost Savings => FSEs can potentially save 1000s of $$$ Streamlined Pumper Efforts => less wasted resources on pick up and processing The data allows the regulator to evaluate the program specifics while the FSE can evaluate the regulations effectiveness. Together this can lead to program improvements and drive down costs to all parties.
SLIDE 26
Thank You
Questions? Mark Ahrendt Riptide Tek mahrendt@riptidetek.com