
SLIDE 1
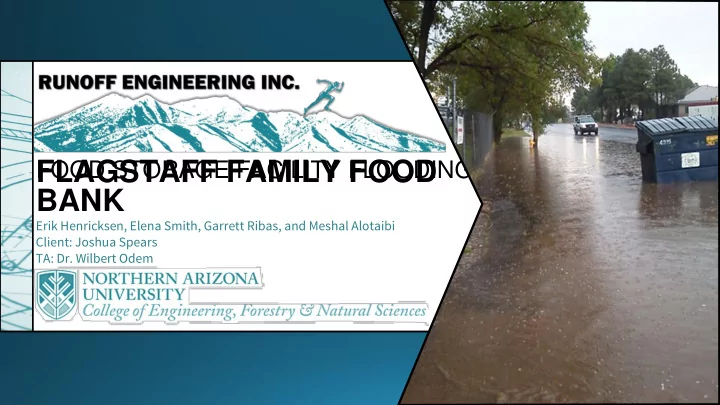
FLAGSTAFF FAMILY FOOD BANK
FOOD STORAGE FACILITY FLOODING
Erik Henricksen, Elena Smith, Garrett Ribas, and Meshal Alotaibi Client: Joshua Spears TA: Dr. Wilbert Odem
1
FLAGSTAFF FAMILY FOOD FOOD STORAGE FACILITY FLOODING BANK Erik - - PowerPoint PPT Presentation
FLAGSTAFF FAMILY FOOD FOOD STORAGE FACILITY FLOODING BANK Erik Henricksen, Elena Smith, Garrett Ribas, and Meshal Alotaibi Client: Joshua Spears TA: Dr. Wilbert Odem 1 BACKGROUND Figure 1: Food Bank Front Entrance Problem Statement Food
Erik Henricksen, Elena Smith, Garrett Ribas, and Meshal Alotaibi Client: Joshua Spears TA: Dr. Wilbert Odem
1
2
2 Figure 1: Food Bank Front Entrance
Figure 2: Flagstaff Network Figure 3: Aerial View of Food Bank Property 3
4
▪ Past and Present Flooding Issue
▪ Official Documents
[3] 4 Figure 4: Official Documents Example [2]
5
Figure 7: BEFORE HEAVY RAIN EVENT [1] Figure 8: DURING HEAVY RAIN EVENT: Monsoon (July and August) [1] 5
6 6 6 66
6 Figure 5: Watershed Near Humphreys Peak [2] Figure 6: Existing Pipelines Near Food Bank [2] 6
Historic Watershed
7
7 Figure 9: North-West Corner of Food Bank Property (Food Bank Property meets E. Huntington Rd.)
8
Figure 10: Front Entrance Figure 11: Front Concrete Barricades Figure 12: Further Flooding Prevention (Sandbags)
8
9 9 9 99 9
➢ Neighborhood Assessment ➢ Collaboration with the City of Flagstaff
▪ Stakeholders ▪ Liability ▪ Legal Terms: Property rights, right of way, ADOT
9 9 Figure 13: Property Breakdown
10 10 10 1 10
Figure 14: On-site Evaluation Figure 15: Survey Point Grid Figure 16: Surveying Property 10
11 11 11 11 11 11 11
11 Figure 17: Topographic Map of Property Figure 18: Topographic Map of Property W/ Food Bank Buildings
12 12 12
public and private stormwater management facilities shall be in accordance… with the City of Flagstaff Stormwater Management Design Manual and these Standards.”
➢Chapter 3: Hydrology ➢ Chapter 5: Culverts ➢ Chapter 6: Pavement Drainage ➢ Chapter 7: Storm Drains ➢ Chapter 8: Storage and Detention Facilities ➢ Chapter 10: Erosion and Sediment Control ➢ Chapter 11: Energy Dissipaters
1 2 12 12 [4] [4] [4]
13 13 13 1 3 13 13 13 13
City of Flagstaff Stormwater Management Design Manual
Rationale Formula Partially Full Flowing Pipes Criteria Runoff Coefficients
NOAA Atlas 14 Data
Rainfall Intensities
Coconino County Maps Online
Property Boundaries 13 [4] [5] [6] 13
14 14 14 14
14 Table 1: Runoff Intensity, NOAA Atlas 14 [5] Figure 19: Area of Property (Red)
15 15 15 1 5 15 15 15 15
15 Figure 20: Hydraulic Elements Calculations
16 16 16 1 6 16 16 16 16
16 16 16 Figure 21: Pipe Sizing Calculations Using Q Figure 22: Verification Calculations
17 17 17 1 7 17 17 17 17
17 17 17
Table 4: FS for Sliding = 1.73 > 1.5 Table 5: FS for Bearing Capacity = 7.22 > 3
Table 3: FS for Overturning = 3.3 > 2
Figure 23 : Stability Failure Checks for Retaining Walls [7]
18
18 18 1 8 18 18 18 18 18
Design Option 1: Retaining Wall W/ Commercial Drainage System
Figure 25: Design Option 1 Retaining Wall Detail Figure 26: Aerial View of Design Option 1
19
19 19 1 9 19 19 19 19 19
Design Option 1: Retaining Wall W/ Commercial Drainage System
Figure 27: Design Option 1 Cross Sectional View Figure 28: Top and Side View of Commercial Drain
20
20 20 2 20 20 20 20 20
Design Option 2: Retaining Wall W/ Valley Gutters
Figure 29: Design Option 2 Retaining Wall Detail Figure 30: Aerial View of Design Option 2
21
21 21 2 1 21 21 21 21 21
Design Option 2: Retaining Wall W/ Valley Gutters
Figure 30: Design Option 2 Valley Gutter Detail
22
22 22 2 2 22 22 22 22 22 Figure 31: Design 1 Figure 32: Design 2
23
23 23 23 2 3 23 23 23 23 Figure 33: City of Flagstaff Stormwater Division Retention Basin Design
24 24 24 2 4 24 24 24 24
24 24
25
25 25 25 25 25 25
Final Design Alleviate Flooding Avoid Neighbo r Runoff Avoid Front Entry Flooding Avoidance
Flooding Food Bank Continue to Serve Public No Governmenta l Impacts ADOT City of Flagstaff
Figure 34: Project Impact Flow Chart
26
26 26 2 6 26 26 26 26 26
27
27 27 2 7 27 27 27 27 27
28
28 28 2 8 28 28 28 28 28
29
[1](2016) Donna Curry, Engineering Specialist [2](2016) Rick Barrett, City of Flagstaff, City Engineer [3] (2016). City of Flagstaff. Available: http://www.flagstaff.az.gov/. [4] (July 2000) City of Flagstaff Engineering Division, "Stormwater management," in City
[5] (August 27, 2014). NOAA ATLAS 14 POINT PRECIPITATION FREQUENCY ESTIMATES: AZ [NOAA Atlas 14]. Available: http://hdsc.nws.noaa.gov/hdsc/pfds/pfds_map_cont.html?bkmrk=az. [6](2016). County Maps [Coconino Parcel Viewer]. Available: https://gismaps.coconino.az.gov/ParcelViewer/. [7] (2016). CE-RE. Available: http://www.ce- ref.com/Foundation/Retaining_wall/Retaining_wall.html
29 29 2 9 29 29 29 29 29
RESEARCH ANALYSIS DESIGN
30