
Years in business: Number of employees: Total facility square feet: Number delivery vehicles: Number of food vendors: Number of customers: Initial financing: Growth financing: NATIONAL GOOD FOOD NETWORK CONFERENCE MARCH 2018
CASE STUDY FOOD HUB 1
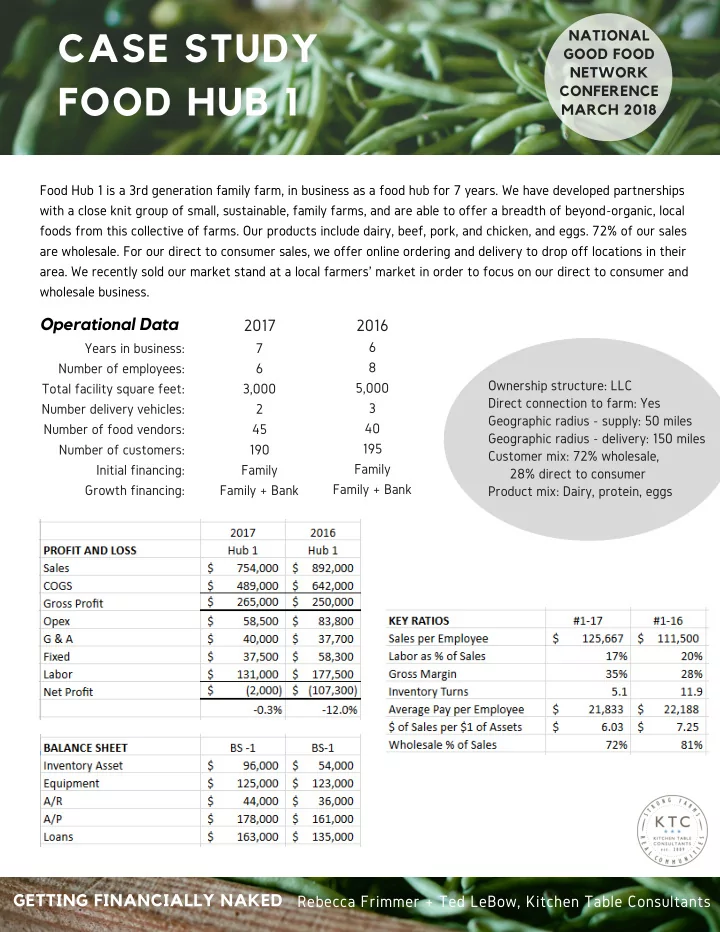
Food Hub 1 is a 3rd generation family farm, in business as a food hub for 7 years. We have developed partnerships with a close knit group of small, sustainable, family farms, and are able to offer a breadth of beyond-organic, local foods from this collective of farms. Our products include dairy, beef, pork, and chicken, and eggs. 72% of our sales are wholesale. For our direct to consumer sales, we offer online ordering and delivery to drop off locations in their
- area. We recently sold our market stand at a local farmers' market in order to focus on our direct to consumer and
wholesale business.
Operational Data GETTING FINANCIALLY NAKED Rebecca Frimmer + Ted LeBow, Kitchen Table Consultants 2017 2016
7 6 3,000 2 45 190 Family Family + Bank 6 8 5,000 3 40 195 Family Family + Bank Ownership structure: LLC Direct connection to farm: Yes Geographic radius - supply: 50 miles Geographic radius - delivery: 150 miles Customer mix: 72% wholesale, 28% direct to consumer Product mix: Dairy, protein, eggs