Case Study Presentation to Utility Districts April 8-9, 2013 - - PowerPoint PPT Presentation

case study
SMART_READER_LITE
LIVE PREVIEW

Case Study Presentation to Utility Districts April 8-9, 2013 - - PowerPoint PPT Presentation

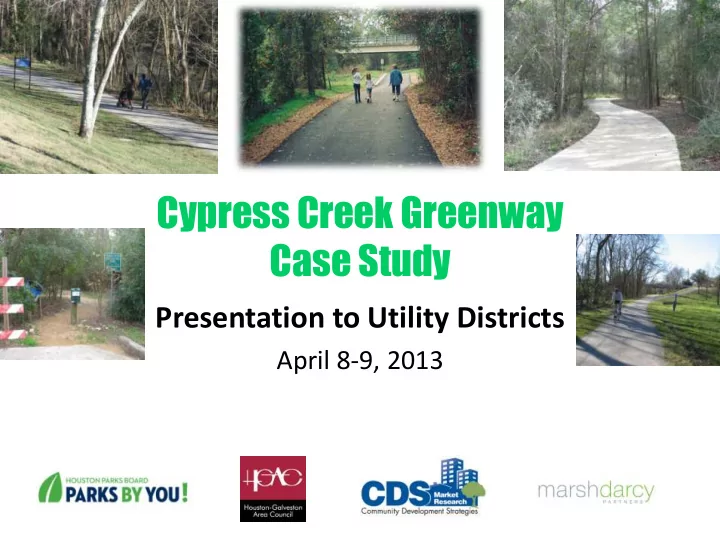
Cypress Creek Greenway Case Study Presentation to Utility Districts April 8-9, 2013 Cypress Creek Greenway Case Study Case Study: What and Why? Part of Houston- Galveston Area Councils Regional Plan for Sustainable Development One


slide-1
SLIDE 1

Cypress Creek Greenway Case Study

Presentation to Utility Districts

April 8-9, 2013

slide-2
SLIDE 2

Cypress Creek Greenway Case Study

  • Part of Houston-Galveston Area Council’s

Regional Plan for Sustainable Development

  • One of six case studies
  • Case Study local sponsor: Houston Parks

Board

  • Consultant team:

– CDS Market Research – Marsh Darcy Partners

Case Study: What and Why?

slide-3
SLIDE 3

Cypress Creek Greenway Case Study

  • Bayou Greenways Initiative

– City of Houston greenways – federal grant and City resources – Spring Creek – adopted by Harris and Montgomery counties – Cypress Creek: no designated public entity or funding source

Case Study: What and Why?

slide-4
SLIDE 4

Cypress Creek Greenway Case Study

HUD Six Livability Principles

  • 1. Provide more transportation choices.
  • 2. Promote equitable, affordable housing.
  • 3. Enhance economic competitiveness.
  • 4. Support existing communities.
  • 5. Coordinate policies and leverage investment.
  • 6. Value communities and neighborhoods.
slide-5
SLIDE 5

Cypress Creek Greenway Case Study

Bayou Greenway Initiative

slide-6
SLIDE 6

Cypress Creek Greenway Case Study

Cypress Creek Corridor

slide-7
SLIDE 7

Cypress Creek Greenway Case Study

Case Study: What and Why?

  • Case Study purpose: develop basis for

continuing further discussion to move Cypress Creek Greenway forward

  • Dialogue with:

– Residents – Commercial property / business owners – Government entities such as utility districts – Other community groups

  • Produce demonstrations of commitment
slide-8
SLIDE 8

Cypress Creek Greenway Case Study

Fractured Governance

Three County Commissioner Precincts

slide-9
SLIDE 9

Cypress Creek Greenway Case Study

Fractured Governance

68+ Utility Districts

slide-10
SLIDE 10

Cypress Creek Greenway Case Study

Governance

  • Harris County

– Three commissioner precincts – Flood Control District

  • 68+ utility districts

– Some have lost assessed value since 2002 – At least 38 with Special Partnership Agreements (SPAs) – Some have issued park bonds

slide-11
SLIDE 11

Cypress Creek Greenway Case Study

Work to Date

  • Demographic and economic research
  • Greenway Benefits Model
  • Public outreach
slide-12
SLIDE 12

Cypress Creek Greenway Case Study

Demographic and Economic Characteristics

Area Population Growth 2000 Census 2010 Census Difference Region Count Count Change % Change East Region 70,240 95,621 25,381 36.1% Central Region 70,875 83,042 12,167 17.2% West Region 25,570 59,434 33,864 132.4% Total Area 166,685 238,097 71,412 42.8%

slide-13
SLIDE 13

Cypress Creek Greenway Case Study

Population Trends

  • Continued population growth
  • Fast-growing population of seniors
  • Rapid diversification of ethnicities
  • Wide range of income levels
slide-14
SLIDE 14

Cypress Creek Greenway Case Study

  • Property Valuation Trends – All Property Types

Count (by Parcel) Assessed Value Change 2008-2012 Whole Area East Central West Less than -50% 1,571 925 261 385

  • 50% to -25%

10,201 8,489 969 743

  • 25% to -10%

25,430 11,520 9,748 4,162

  • 10% to 10%

41,326 9,568 15,801 15,957 10% to 25% 1,699 470 593 636 25% to 50% 964 268 278 418 Greater than 50% 4,421 1,430 800 2,191 Share Assessed Value Change 2008-2012 Whole Area East Central West Less than -50% 1.8% 2.8% 0.9% 1.6%

  • 50% to -25%

11.9% 26.0% 3.4% 3.0%

  • 25% to -10%

29.7% 35.3% 34.3% 17.0%

  • 10% to 10%

48.3% 29.3% 55.5% 65.2% 10% to 25% 2.0% 1.4% 2.1% 2.6% 25% to 50% 1.1% 0.8% 1.0% 1.7% Greater than 50% 5.2% 4.4% 2.8% 8.9%

0% 10% 20% 30% 40% 50% 60% 70% 80% 90% 100% Less than

  • 50%
  • 50% to
  • 25%
  • 25% to -

10%

  • 10% to

10% 10% to 25% 25% to 50% Greater than 50% West Central East Source: HCAD

slide-15
SLIDE 15

Cypress Creek Greenway Case Study

Valuing of Parks and Linear Greenspace

slide-16
SLIDE 16

Cypress Creek Greenway Case Study

Linear Parks and Trails are Cool But Do They have an ROI?

So if a community invests in the design and construction

  • f new trails and acres of

parkland what will they get in return? Or said another way… “What is the ROI of that cool Green Infrastructure?”

Buffalo Bayou Partnership Buffalo and Beyond Master Plan, 2002, prepared by Thompson Design Group

slide-17
SLIDE 17

Cypress Creek Greenway Case Study

Cypress Creek User Map

slide-18
SLIDE 18

Cypress Creek Greenway Case Study

Estimated Benefits

Recreation Benefits $ 7,978,137 Health Benefits $ 2,053,961 Vehicle Operating Cost Savings / Congestion Relief $ 561,061 Crash Reduction $ 38,254 Air Quality: VOC, NOx, CO2 $ 19,198 Carbon Sequestration $ 114 EcoSystem Services $ 2,717,223 Property Value $ 2,966,092 Estimated Annual Total (Moderate) $ 16,334,041 Total Number of Individuals Living Within 1.5 Mile Buffers: 208,913 The following projections are preliminary and will be refined in response to comments from Stakeholders and project participants.

slide-19
SLIDE 19

Cypress Creek Greenway Case Study

The Greenways’ Bottom Line

slide-20
SLIDE 20

Cypress Creek Greenway Case Study

Public Outreach

  • Stakeholder Advisory Group
  • Small-group meetings
  • Facebook page

http://www.facebook.com/CypressCreekGreenwayCaseStudy

  • Email

CypressCreek@marshdarcypartners.com

  • Online survey
  • Public open houses
slide-21
SLIDE 21

Cypress Creek Greenway Case Study

  • Active Users

– March 5

  • Health / Medical

– March 8

  • Education

– March 19

  • Real Estate

– March 20

  • Business

– March 21 & 22

Small Group Stakeholder Meetings

slide-22
SLIDE 22

Cypress Creek Greenway Case Study

Small Group Stakeholder Meetings

  • Broad and enthusiastic support the Cypress Creek

Greenway concept

  • Varying priorities (health, strengthening

community, economic competitiveness, revitalization) but widely viewed as a key asset

  • Comments that benefits analysis too conservative
  • Encourage pursuit of diverse array of funding

sources

  • County viewed as key player; existing entities

working in partnership

slide-23
SLIDE 23

Cypress Creek Greenway Case Study

  • March 19 – West

Saint Aidan's Episcopal Church; 7 attendees

  • March 21 – Central

Cypress Creek Christian Church; 31 attendees

  • March 26 – East

Mercer Arboretum & Botanic Gardens; 42 attendees

Open House Meetings

slide-24
SLIDE 24

Cypress Creek Greenway Case Study

Questions for the Community

  • Do you support the Cypress Creek Greenway

concept? Why or why not?

  • What key features and amenities need to be part
  • f the Greenway?
  • What are the high-priority and high-opportunity

locations along Cypress Creek to focus efforts in the near term?

  • What are acceptable ways to fund the Greenway

project?

  • Who should eventually manage the project?
slide-25
SLIDE 25

Cypress Creek Greenway Case Study

Interim Survey Results 4/4/13

  • Over 400 completed surveys
  • Average benefits ratings (-2 to +2):

– Health 1.64 – Economic 1.21 – Recreation 1.71 – Transportation 1.12 – Flooding / erosion 1.41 – Environment / open space 1.57

slide-26
SLIDE 26

Cypress Creek Greenway Case Study

Interim Survey Results 4/4/13

  • Concern ratings (-2 to +2):

– Maintenance 0.23 – Security 0.39 – Funding 0.67 – Organization / oversight 0.64

  • Activities:

– Biking, walking – Other: running, off-road biking, disc golf, kayaking

slide-27
SLIDE 27

Cypress Creek Greenway Case Study

Interim Survey Results 4/4/13

  • Strongly agree:

– The Greenway would benefit residents and businesses in Northwest Harris County. – 76.6% – Implementing the Greenway should be a high

  • priority. – 68.2%

– I would want the Greenway to connect to my

  • neighborhood. – 70.0%
slide-28
SLIDE 28

Cypress Creek Greenway Case Study

Interim Survey Results 4/4/13

  • Most desired features:

– Trash cans 59.3% – Restrooms 56.3% – Directional signs / maps 47.9% – Connections to neighborhoods 44.4% – User parking 40.9%

  • 74.1% very supportive of continuing

discussions

  • 61.6% willing to get involved
slide-29
SLIDE 29

Cypress Creek Greenway Case Study

Utility District Outreach

  • Group meetings April 8 and 9, 7:00 – 8:15

p.m.

  • Over 56 districts contacted
  • Seeking approval from boards of directors

– Sample resolution drafted – Ideal result: secure commitment to move Greenway segments and connections forward

slide-30
SLIDE 30

Cypress Creek Greenway Case Study

Questions and Discussion

  • Willingness to support concept
  • Willingness to work with adjacent districts /

property owners

  • Willingness to contribute funding
  • Board action?
slide-31
SLIDE 31

Cypress Creek Greenway Case Study

Presentation to Utility Districts

April 8-9, 2013