
SLIDE 1
Figure ¡2.25 ¡from ¡page ¡92 ¡of ¡Exploring ¡the ¡Heart ¡of ¡Ma2er ¡
Quark-Gluon Plasma
The Phases of QCD
Temperature
Hadron Gas
Early Universe
Future FAIR Experiments
LHC Experiments
Nuclear Matter Vacuum
Color Superconductor
Critical Point
RHIC Experiments
R H I C E n e r g y S c a n
Crossover
Baryon Chemical Potential
~170 MeV 0 MeV 900 MeV 0 MeV Neutron Stars 1
s t
- r
d e r p h a s e t r a n s i t i
- n
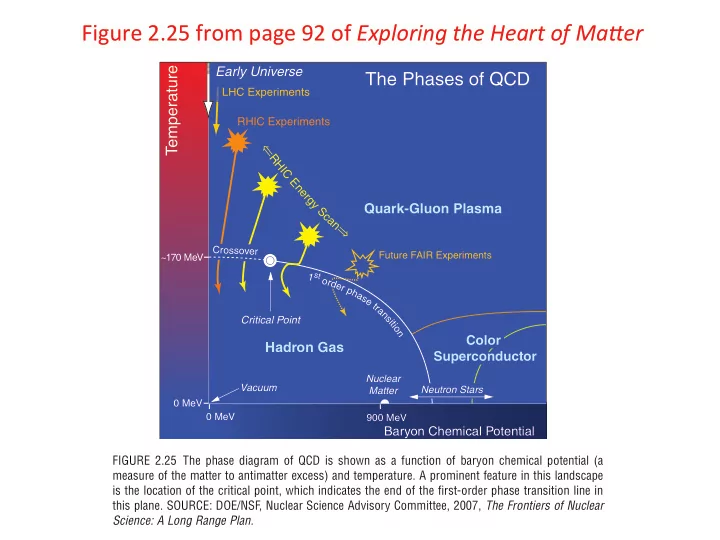
FIGURE 2.25 The phase diagram of QCD is shown as a function of baryon chemical potential (a measure of the matter to antimatter excess) and temperature. A prominent feature in this landscape is the location of the critical point, which indicates the end of the first-order phase transition line in this plane. SOURCE: DOE/NSF, Nuclear Science Advisory Committee, 2007, The Frontiers of Nuclear Science: A Long Range Plan.