figure pet 1 from page 150 of exploring the heart of ma2er
play

Figure PET 1 from page 150 of Exploring the Heart of - PowerPoint PPT Presentation

Figure PET 1 from page 150 of Exploring the Heart of Ma2er e e + 18 F 18 O FIGURE PET 1 Illustration of positron decay. One of the protons (red) in the unstable nucleus is converted into a


  1. Figure ¡PET ¡1 ¡from ¡page ¡150 ¡of ¡ Exploring ¡the ¡Heart ¡of ¡Ma2er ¡ e − e + 18 F 18 O FIGURE PET 1 Illustration of positron decay. One of the protons (red) in the unstable nucleus is converted into a neutron (blue) with the emission of a positive electron (positron). The positron travels a short distance until it is annihilated with a neighboring atomic electron, resulting in two photons ( Ð -rays), each with an energy of 511 keV. The photons will travel at nearly 180° from each other to conserve momentum. SOURCE: T. Ruth, 2011, The uses of radiotracers in the life sciences, Reports on Progress in Physics 72: 016701. Printed with permission from IOP Publishing Ltd. • Where ¡in ¡the ¡Table ¡of ¡Nuclides ¡do ¡isotopes ¡decay ¡by ¡positron ¡emission ¡(β + )? ¡ • PET ¡imaging ¡is ¡said ¡to ¡use ¡the ¡“self-­‑collimaAng” ¡nature ¡of ¡positron ¡decay. ¡ ¡ ¡ • Use ¡ring ¡of ¡detectors ¡triggering ¡in ¡coincidence ¡to ¡back-­‑project ¡to ¡positron ¡emiGer. ¡ ¡ • Why ¡is ¡ 18 F ¡a ¡good ¡choice? ¡ • Nuclear ¡physics ¡contribuAons: ¡isotope ¡producAon ¡(e.g., ¡BNL), ¡detector ¡materials ¡ (e.g., ¡new ¡scinAllators), ¡improved ¡detecAon ¡systems. ¡ ¡ ¡
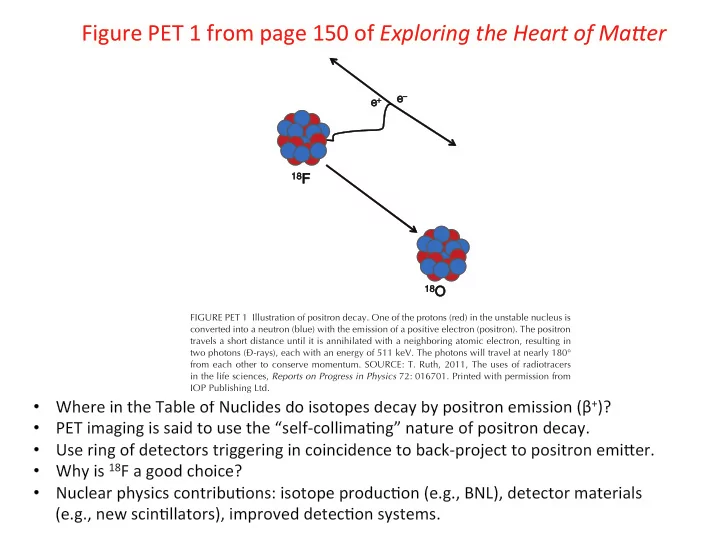
  2. Figure ¡PET ¡2 ¡from ¡page ¡152 ¡of ¡ Exploring ¡the ¡Heart ¡of ¡Ma2er ¡ FIGURE PET 2 The three panels from left to right show a combined FDG PET/computed tomog- raphy (CT) image in transaxial, saggital, and coronal views. The colored hot metal image is the PET image and the gray image is from the CT camera. The combined image enables physicians to determine the precise location of abnormal function (high uptake in the mass visible on the chest wall in the CT image in this case). In addition, a metastatic tumor is visible in the pelvic region. SOURCE: T. Ruth, 2011, The uses of radiotracers in the life sciences, Reports on Progress in Physics 72: 016701. Photo courtesy of British Columbia Cancer Agency and reprinted with permission from IOP Publishing Ltd.

  3. Figure ¡3.1 ¡from ¡page ¡155 ¡of ¡ Exploring ¡the ¡Heart ¡of ¡Ma2er ¡ FIGURE 3.1 PET is a powerful tool to probe the functions of the brain. In these images of the brain, the radionuclide is fluorine-18 while the molecules for each image obviously have different biodistribu- tions. The left-hand figure shows fluorodopa (to probe dopamine integrity) while the right-hand figure shows fluorodeoxyglucose (to probe sugar metabolism). SOURCE: Courtesy of Don Wilson, British Columbia Cancer Agency.

Download Presentation
Download Policy: The content available on the website is offered to you 'AS IS' for your personal information and use only. It cannot be commercialized, licensed, or distributed on other websites without prior consent from the author. To download a presentation, simply click this link. If you encounter any difficulties during the download process, it's possible that the publisher has removed the file from their server.

Recommend


More recommend