SLIDE 1
20 40 60 80 100 0.00 0.10 0.20 0.30 0.40 0.50 0.60 Rate (%)
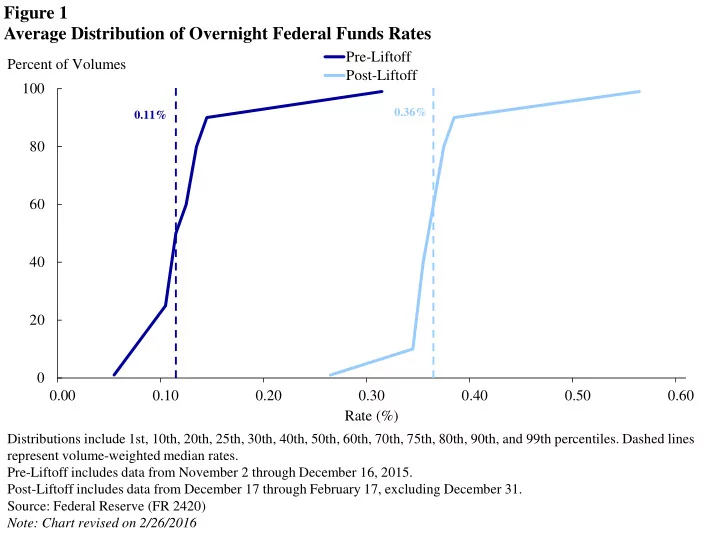
Figure 1 Average Distribution of Overnight Federal Funds Rates
Pre-Liftoff Post-Liftoff
Distributions include 1st, 10th, 20th, 25th, 30th, 40th, 50th, 60th, 70th, 75th, 80th, 90th, and 99th percentiles. Dashed lines represent volume-weighted median rates. Pre-Liftoff includes data from November 2 through December 16, 2015. Post-Liftoff includes data from December 17 through February 17, excluding December 31. Source: Federal Reserve (FR 2420) Note: Chart revised on 2/26/2016
Percent of Volumes
0.11% 0.36%
SLIDE 2
0.1 0.2 0.3 0.4 0.5 0.6 Jan-15 Mar-15 May-15 Jul-15 Sep-15 Nov-15 Jan-16 Percent
Figure 2 Effective Federal Funds Rate
Federal Funds Target Range Effective Federal Funds Rate
The effective federal funds rate is a volume-weighted average of rates on trades arranged by major brokers. Source: Federal Reserve Bank of New York, FOMC
Year- End
SLIDE 3
0.0 0.1 0.2 0.3 0.4 0.5 0.6 Nov-15 Dec-15 Jan-16 Feb-16 Percent
Figure 3 Volume-Weighted Mean and Median Overnight Federal Funds Rates
Volume-Weighted Median Volume-Weighted Mean
Source: Federal Reserve (FR 2420)
Dec. FOMC
SLIDE 4
20 40 60 80 100 0.00 0.10 0.20 0.30 0.40 0.50 0.60 Rate (%)
Figure 4 Average Distribution of Overnight Eurodollar Rates
Pre-Liftoff Post-Liftoff
Distributions include 1st, 10th, 20th, 25th, 30th, 40th, 50th, 60th, 70th, 75th, 80th, 90th, and 99th percentiles. Dashed lines represent volume-weighted median rates. Pre-Liftoff includes data from November 2 through December 16, 2015. Post-Liftoff includes data from December 17 through February 17, excluding December 31. Source: Federal Reserve (FR 2420) Note: Chart revised on 2/26/2016
Percent of Volumes
0.12% 0.36%
SLIDE 5
0.0 0.1 0.2 0.3 0.4 0.5 0.6 Nov-15 Dec-15 Jan-16 Feb-16 Percent
Figure 5 Volume-Weighted Mean and Median Overnight Eurodollar Rates
Volume-Weighted Median Volume-Weighted Mean
Source: Federal Reserve (FR 2420)
Dec. FOMC
SLIDE 6
20 40 60 80 100 0.00 0.10 0.20 0.30 0.40 0.50 Rate (%)
Figure 6 Average Distribution of Overnight Treasury Tri-party Repo Rates
Pre-Liftoff Post-Liftoff
Distributions include 1st, 10th, 20th, 25th, 30th, 40th, 50th, 60th, 70th, 75th, 80th, 90th, and 99th percentiles. Dashed lines represent volume-weighted median rates. Treasury GCF repo transactions are not included in these data. Pre-Liftoff includes data from November 2 through December 16, 2015. Post-Liftoff includes data from December 17 through February 17, excluding December 31. Source: BNYM, JPMC Note: Chart revised on 2/26/2016
Percent of Volumes
0.08% 0.30%
SLIDE 7
0.1 0.2 0.3 0.4 0.5 0.6 0.7 Jan-15 Mar-15 May-15 Jul-15 Sep-15 Nov-15 Jan-16 Percent
Figure 7 3-Month Term Money Market Rates
U.S. T-Bill AA Financial Commercial Paper Overnight Indexed Swap (EFFR)
Source: Federal Reserve Board of Governors, Bloomberg
Dec. FOMC
SLIDE 8
Percentile 12/30/2015 12/31/2015 1st 0.25 0.08 25th 0.34 0.15 50th 0.35 0.15 75th 0.35 0.25 99th 0.56 0.57
Source: Federal Reserve (FR 2420)
Figure 8 Volume-Weighted Percentiles of Overnight Federal Funds Rates Around Year- End (in Percent)
SLIDE 9
Percentile 12/30/2015 12/31/2015 1st 0.25 0.04 25th 0.34 0.15 50th 0.35 0.25 75th 0.36 0.29 99th 0.40 0.52
Source: Federal Reserve (FR 2420)
Figure 9 Volume-Weighted Percentiles of Overnight Eurodollar Rates Around Year-End (in Percent)
SLIDE 10
50 100 150 200 250 USD, billions Federal Funds Eurodollars ON RRPs
Source: Federal Reserve (FR 2420), Federal Reserve Bank of New York
Figure 10 Daily Volume Change in Overnight Money Market Investments on Year-End
SLIDE 11
50 100 150 200 250 300 350 400 450 500 Jan-15 Mar-15 May-15 Jul-15 Sep-15 Nov-15 Jan-16 USD, billions
Figure 11 ON RRPs and Term RRPs Outstanding
Money Funds Government-Sponsored Enterprises Primary Dealers Banks
Source: Federal Reserve Bank of New York Note: Chart revised on 2/26/2016
Dec. FOMC
SLIDE 12
50 100 150 200 250 300 350 400 Nov-15 Dec-15 Jan-16 Feb-16 USD, billions
Figure 12 Overnight Secured and Unsecured Volumes
Federal Funds Eurodollars Treasury Repo
Treasury Repo includes tri-party Treasury GC and GCF volumes. Source: Federal Reserve (FR 2420), Federal Reserve Bank of New York, BNYM, JPMC, DTCC
Year- End Dec. FOMC
SLIDE 13
50 100 150 200 250 Nov-15 Dec-15 Jan-16 Feb-16 USD, billions Non-Bank Financial Institutions (Eurodollars) Government-Sponsored Enterprises (Fed Funds)
Source: Federal Reserve (FR 2420)
Year- End Dec. FOMC
Figure 13 Overnight Federal Funds and Eurodollar Volumes for Select Lender Types
SLIDE 14
Quarter >$10 Billion Overnight >$30 Billion Combined Term and Overnight Q1 2015 58 Q2 2015 49 Q3 2015 29 Q4 2015 73 Q1 2016 10
Q1 2016 includes data through February 17. Source: Federal Reserve Bank of New York Note: Chart revised on 2/26/2016
Figure 14 Number of Large RRP Bid Submissions
SLIDE 15
50 100 150 200 250 300 350 400 450 500 Jan-15 Mar-15 May-15 Jul-15 Sep-15 Nov-15 Jan-16 USD, billions
Figure 15 Aggregate RRPs Outstanding
Term Overnight
Source: Federal Reserve Bank of New York Note: Chart revised on 2/26/2016
SLIDE 16 Quarter Foreign Repo Pool Rate Standard Deviation Foreign Repo Pool Rate less Tri-party Rate Correlation Q1 2015 0.07 0.03
0.980 Q2 2015 0.09 0.03
0.982 Q3 2015 0.11 0.03
0.990 Q4 2015 0.12 0.09
0.998 Q1 2016 0.33 0.02
0.885
Average rates are calculated over business days. Tri-party Rate includes tri-party Treasury GC and GCF. Q1 2016 includes data through February 17. Note: Chart revised on 2/26/2016
Figure 16 Average Daily Foreign Repo Pool and Tri-party Repo Rates
Source: Federal Reserve Bank of New York, BNYM, JPMC, DTCC