
SLIDE 1
Family History of Incarceration
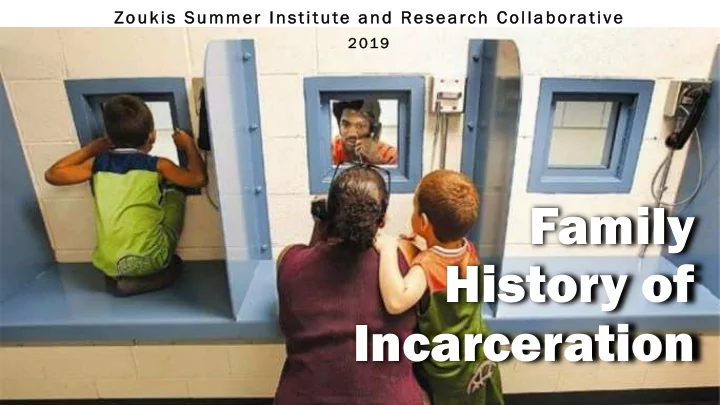
Zo Zouk ukis S is Sum ummer er Inst Instit itut ute a e and nd R Resea esearch C Collabo borativ ive
2 0 2 019
Family History of Incarceration INCARCERATION & RECIDIVISM - - PowerPoint PPT Presentation
Zo Zouk ukis S is Sum ummer er Inst Instit itut ute a e and nd R Resea esearch C Collabo borativ ive 2 0 2 019 Family History of Incarceration INCARCERATION & RECIDIVISM FAMILY HISTORY OF INCARCERATION RESEARCH GROUP
Zo Zouk ukis S is Sum ummer er Inst Instit itut ute a e and nd R Resea esearch C Collabo borativ ive
2 0 2 019
FAMILY HISTORY OF INCARCERATION RESEARCH GROUP
convicted for a crime, and who has been caught again for committing the crime and breaking the law for which he had been prosecuted in an earlier case.
families of the accused.
factors, but our research focuses on how educational attainment, substance addiction, and household income adversely affect whether an individual is more probable in being a repeat offender.
H1: As household income increases, the probability of being a repeat offender decreases H2: As educational attainment increases, the probability of being a repeat
H3: Incarcerates with a history of addiction are more likely to be repeat
Variables Coefficient (Standard Error)
Educational Attainment
(0.067) Metropolitan Area
(0.167) Household Income
(0.015) Homeownership 0.065 (0.103) Employment Status
(0.064) Incarcerate Addiction History 1.664*** (0.114)
***p≤.01; **p≤.05; *p≤.10
Among Incarcerated Family Members
Family History of Incarceration Survey (FamHIS). The sample of respondents is 1, 975.
attained a higher education, or has a high school diploma, then the probability of the incarcerated relative being a repeat offender is less likely.
Variables Coefficient (Standard Error) Educational Attainment
(0.067)
Variable Coefficient (Standard Error) Household Income
(0.015)
the probability of a relative being a repeat offender decreases.
addiction in the past, the probability of being a repeat
Variable Coefficient (Standard Error) Addiction History 1.664*** (0.114)
from its minimum to maximum value results in a -0.10 probability of recidivism.
to maximum value results in a -0.22 probability of recidivism.
addiction have a +0.35 probability of recidivism.
Undergraduate Students: Kara Nelson, LaJayla Parker, Joshua Buffa
have been incarcerated for at least one night
!(#$$%&#'(% ')& %*(%)&%& +'$#,- $%$1%/2)
Variables Coefficient (Standard Error) Educational Attainment
(1.352) White
(2.281) Gender 6.261*** (2.243) Household Income
(0.994) Metropolitan Area
(0.773) Household Size
(0.773) Marital Status 3.261*** (1.567) ***p ≤.01; **p ≤..05; *p[≤..10
Undergraduates: Meeyabonyui Aneneba, Elice Agostini, Noor Smadi, Chris Valley, Gaia Harper Graduates: Bailey Fairbanks, Kristina LaPlant
■ What is the emotional impact of visiting an incarcerated family member? ■ Do different racial groups experience different emotions during visits? ■ Do people experience different emotions when the incarcerated family member is a parent, sibling, or child? ■ Do family members experience different emotions during visits if the incarcerated struggles with addiction or is a repeat offender?
■ Sadness: sad, sorrow, depression, heartbreaking, awful, terrible, emotionally drained, lonely, hurtful, painful, dehumanizing. ■ Anxiety: embarrassment, discomfort, discouraging, awkwardness, shame, scary, monitored, unpleasant, unsettling, confined/controlled, shocking. ■ Anger: degrading, disgust, resentful, unfair/unjust, frustration.
Bl Black Wh White Hi Hispanic Ot Other 25.29% (106) 51.78% (217) 15.99% (67) 6.92% (29) Sample characteristics N= 419
Mo Mother er Fa Father Si Sibling Chi Child ld Pa Partner 19 45 142 136 57 4.53% 10.7% 33.89% 32.45% 13.6%