
SLIDE 1
1
FSSD’s Ongoing Path Towards Energy Neutrality
Fairfield‐Suisun Sewer District BAYWORK North Bay II Workshop on Wheels October 14, 2015 Ben Carver & Jordan Damerel
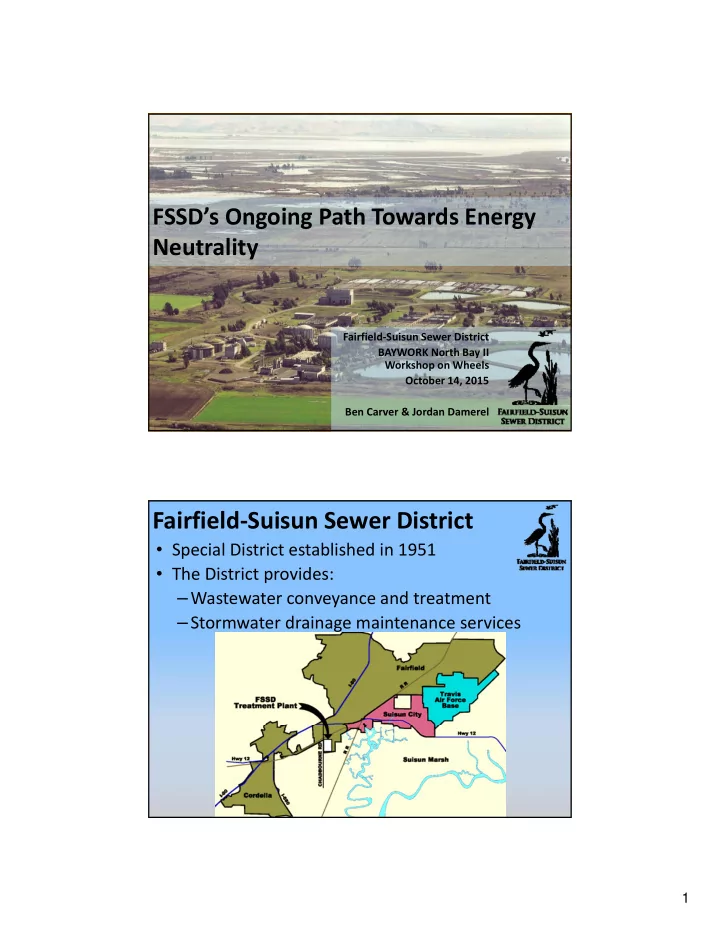
Fairfield‐Suisun Sewer District
- Special District established in 1951
- The District provides: