EDGEWOOD SEWER MAINTENANCE DISTRICT KENSINGTON SQUARE SEWER - - PowerPoint PPT Presentation
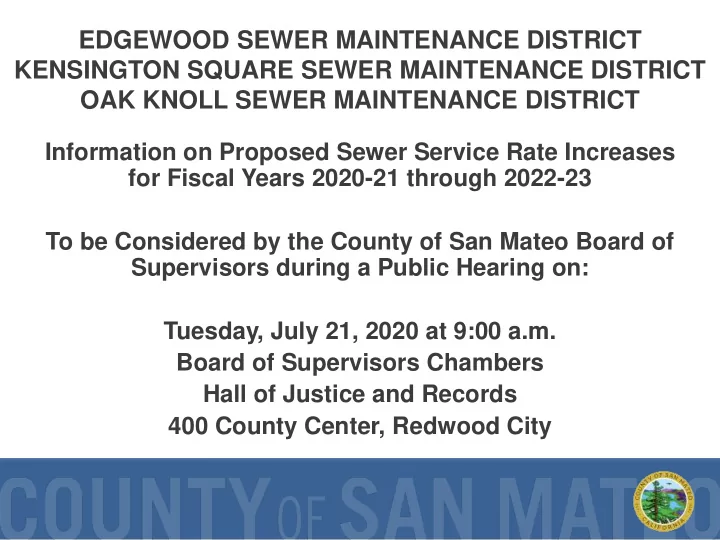
EDGEWOOD SEWER MAINTENANCE DISTRICT KENSINGTON SQUARE SEWER MAINTENANCE DISTRICT OAK KNOLL SEWER MAINTENANCE DISTRICT Information on Proposed Sewer Service Rate Increases for Fiscal Years 2020-21 through 2022-23 To be Considered by the County
OVERVIEW
- District Information
- District Funding
- Programs, Services and Compliance
- Elements of the Sewer Service Rates
- In District Costs
- Out of District Costs
- Proposed Rate for Consideration
- Rate Setting Timeline
DISTRICT INFORMATION - EDGEWOOD SEWER MAINTENANCE DISTRICT
District Boundary Redwood Shores San Carlos Redwood City Foster City Belmont
SEWAGE FLOWS THROUGH CITY OF REDWOOD CITY TO THE SILICON VALLEY CLEAN WATER (SVCW) SEWAGE TREATMENT PLANT IN REDWOOD SHORES FOR TREATMENT
DISTRICT INFORMATION - KENSINGTON SQUARE SEWER MAINTENANCE DISTRICT
District Boundary Redwood Shores San Carlos Redwood City Belmont
SEWAGE FLOWS THROUGH CITY OF REDWOOD CITY TO THE SILICON VALLEY CLEAN WATER (SVCW) SEWAGE TREATMENT PLANT IN REDWOOD SHORES FOR TREATMENT
DISTRICT INFORMATION - OAK KNOLL SEWER MAINTENANCE DISTRICT
SEWAGE FLOWS THROUGH CITY OF REDWOOD CITY TO THE SILICON VALLEY CLEAN WATER (SVCW) SEWAGE TREATMENT PLANT IN REDWOOD SHORES FOR TREATMENT
District Boundary Redwood Shores San Carlos Redwood City District Boundary District Boundary Belmont
Image Source: Pixel-Gym
EACH DISTRICT RELIES ON DOWNSTREAM AGENCIES TO TRANSPORT SEWAGE COLLECTED BY THE DISTRICT TO THE TREATMENT PLANT
DISTRICT INFORMATION – HOW DOES A SEWER SYSTEM WORK?
Source: City of San Mateo Clean Water Program.
I & I
DISTRICT SPECIFIC STATISTICS
District Age (Years) * Number of Connections ** Equivalent Residential Units (ERU) Downstream Transport Agency Treatment Facility Edgewood SMD 14 15 15 City of Redwood City Silicon Valley Clean Water (SVCW) Kensington Square SMD 64 74 74 Oak Knoll SMD 63 134 145
District Miles of Pipe Percentage
- f Pipe in
Easements Percentage of Pipe in Streets Edgewood SMD 0.3 28.75% 71.25% Kensington Square SMD 0.8 0.00% 100.00% Oak Knoll SMD 1.5 33.43% 66.57%
*Age based on District formation date ** Based on 2019-20 Sewer Service Charge Report
SEWER/SANITATION DISTRICTS IN COUNTY GOVERNMENT
EACH DISTRICT IS AN INDEPENDENT ENTITY WITH ITS OWN SEPARATE BUDGET
- Each District’s Governing Board is the Board of
Supervisors
- The District receives Sewer Service Charges and limited
property taxes within the District boundaries to fund sewer service
- The Sewer Service Charges are a Fee For Service, Not
a Tax
- The District collects Sewer Service Charges on the Tax
Bill because it is least costly way to collect the fee
WHERE DOES MY PROPERTY TAX MONEY GO?
EDGEWOOD SEWER MAINTENANCE DISTRICT:
- No Property Tax Revenue Allocation
- District formed in 2004, after Proposition 13
WHERE DOES MY PROPERTY TAX MONEY GO?
General County Tax 25.14% Free Library 3.67% County Fire Protection 6.81% RWC Elem School 25.07% SU High School 16.57% SM Junior College 7.19%
Kensington Sq SMD 5.79%
Emerald Lake Lighting 1.70% Mid Pen ROSD 1.95% Air Quality Mngmnt 0.22% County Harbor District 0.37% Mosquito Abatement 0.20% Sequoia Hospital Dist 1.55% County Education Tax 3.74%
KSSMD Sample Property Tax Allocation (TRA 073-032)
Note: KSSMD allocation of a portion (05.79%) of the property tax is approximately $13,700 per year.
WHERE DOES MY PROPERTY TAX MONEY GO?
General County Tax 26.29% Free Library 3.83% County Fire Protection 7.12% RWC Elem School 26.22% SU High School 17.32% SM Junior College 7.52%
OKSMD 1.51%
Emerald Lake Lighting 1.78% Mid Pen ROSD 2.04% Air Quality Mngmnt 0.23% County Harbor District 0.39% Mosquito Abatement 0.21% Sequoia Hospital Dist 1.62% County Education Tax 3.91%
OKSMD Sample Property Tax Allocation (TRA 073-008)
Note: OKSMD allocation of a portion (05.79%) of the property tax is approximately $5,000 per year.
PROGRAMS, SERVICES AND COMPLIANCE
- Purchased shared maintenance equipment (CCTV
camera, flushing/vacuum trucks, and Vac-Con flusher- vacuum truck)
- Sanitary Sewer Overflow (SSO) Response, Reporting,
Water Quality Monitoring, and Public Awareness Program
- Development and continuous updating of Sewer System
Management Plan (SSMP)
- Continue to provide 24/7 emergency response to clear
blockages in private laterals and services during COVID-19 pandemic
SANITARY SEWER OVERFLOWS (SSO)
Preventative maintenance on District sewer mains is being performed at frequencies ranging from 12 to 36 months, depending on conditions.
PROGRAMS, SERVI CES AND COMPLI ANCE
District 2015 2016 2017 2018 2019 2020 (to date) ESMD KSSMD OKSMD
POLLUTION PREVENTION/PUBLIC AWARENESS PROGRAM
In May 2020 due to COVID-19 shelter-in-place orders and to increase awareness about not flushing cleaning and sanitizing “flushable wipes” the above message was added to the sewer district website: http://www.smcgov.org/sewers
PROGRAMS, SERVICES AND COMPLIANCE
Beginning in 2012, brochures have been distributed to customers during service calls and mailed to customers upstream of a sanitary sewer overflow. Copies are also available on website at http://www.smcgov.org/sewers
PROGRAMS, SERVICES AND COMPLIANCE
POLLUTION PREVENTION/PUBLIC AWARENESS PROGRAM
IN DISTRICT COSTS:
- Operation and Maintenance
- Regulation Compliance
- District Projects
OUT OF DISTRICT COSTS:
- Sewage Transport and Treatment
- Downstream Agency Capital Improvement Projects
DISTRICT EXPENSES
HIGH PRIORITY CIPs IDENTIFIED IN EACH DISTRICT THROUGH MASTER PLANS AND CONDITION ASSESSMENTS
- Improvements are recommended based on the
following:
- Lack of capacity in pipe
- Excessive maintenance costs
- Structural defects in pipe
- Portions of your Sewer Service Charges collected
are used to pay for improvements.
ELEMENTS OF THE SEWER SERVICE RATES – CAPITAL IMPROVEMENT PROJECTS (CIP)
COMPLETED CAPITAL IMPROVEMENT PROJECTS - KENSINGTON SQUARE SMD
COMPLETED CAPITAL IMPROVEMENT PROJECTS - OAK KNOLL SMD
FUTURE PROJECTS AND ESTIMATED COSTS
Kensington Square SMD: Phase 2 - Upton St. and Alameda de las Pulgas-south segment (1,800 ft) $665,000 Oak Knoll SMD: Don Ct. and Maloney Ct. (770 ft) $269,000
ELEMENTS OF THE SEWER SERVICE RATES – FUTURE PLANNING
- Sewage Transport, Treatment, and Disposal
- Downstream Agency Capital Improvement
Projects
ELEMENTS OF THE SEWER SERVICE RATES – OUT OF DISTRICT COSTS
- Each District has an Agreement with the City of
Redwood City for sewage transport through City pipes with treatment and disposal at the SVCW
- Edgewood SMD, Kensington Square SMD, and Oak
Knoll CSD pays 100% of the City rate
- City increases of 4.5% average annual rate increase
for FYs 2019-22
- Based on number of connections for all 3 districts,
with 1 commercial property in Oak Knoll SMD which is based on water consumption
SEWAGE TRANSPORT, TREATMENT, AND DISPOSAL
ELEMENTS OF THE SEWER SERVICE RATES – OUT OF DISTRICT COSTS
- Sewer Service Rates established by Redwood City
- Capital Improvement Projects at the SVCW:
- Capital improvements will replace equipment which
have reached the end of their useful lives
- SVCW has spent $455 million thru February 2020
(over 12 years)
- In March 2020, SVCW estimates $477 million in CIP
expenditures over the next 7 years
- SVCW will be charging the member agencies
(Redwood City, San Carlos, Belmont, and West Bay Sanitary District) for the capital improvements
WHAT AFFECTS THE AMOUNT THE DISTRICT PAYS?
ELEMENTS OF THE SEWER SERVICE RATES – OUT OF DISTRICT COSTS
ELEMENTS OF THE SEWER SERVICE RATES
$1,902 $4,441 $4,621 $4,808 $12,522 $5,206 $14,083 $14,717 $15,379 $16,071 $16,794 $17,550 $23,527 $24,227 $24,653 $25,075 $25,492 $25,453
$45,207 $52,749 $57,818 $62,471 $66,666 $62,841
$0 $10,000 $20,000 $30,000 $40,000 $50,000 $60,000 $70,000 $0 $10,000 $20,000 $30,000 $40,000 $50,000 $60,000 $70,000 2018-19 Actual 2019-20 Estimated 2020-21 Estimated 2021-22 Estimated 2022-23 Estimated 2023-24 Estimated
Edgewood SMD Expenditure & Revenue Comparison
O&M and Regulations Transport & Treatment Revenue* (w/ proposed and estimated future rate increases) Fund Balance (Beg. FY)
ELEMENTS OF THE SEWER SERVICE RATES
$12,767 $12,943 $19,898 $20,706 $34,833 $22,420 $425,000 $- $69,477 $72,604 $75,871 $79,285 $82,853 $86,581 $128,190 $127,349 $123,005 $130,975 $138,989 $139,511
$413,128 $459,074 $75,877 $103,112 $134,097 $155,400
$0 $100,000 $200,000 $300,000 $400,000 $500,000 $600,000 $0 $100,000 $200,000 $300,000 $400,000 $500,000 $600,000 2018-19 Actual 2019-20 Estimated 2020-21 Estimated 2021-22 Estimated 2022-23 Estimated 2023-24 Estimated
Kensington Square SMD Expenditure & Revenue Comparison
O&M and Regulations District CIP Transport & Treatment Revenue* (w/ proposed and estimated future rate increases) Fund Balance (Beg. FY)
ELEMENTS OF THE SEWER SERVICE RATES
$41,437 $38,920 $40,497 $42,138 $73,612 $45,622 $6,114 $4,310 $269,500 $129,472 $135,299 $141,387 $147,749 $154,398 $161,346 $205,898 $214,817 $231,615 $240,527 $249,471 $242,208
$385,670 $414,545 $450,834 $500,565 $551,205 $303,166
$0 $100,000 $200,000 $300,000 $400,000 $500,000 $600,000 $0 $100,000 $200,000 $300,000 $400,000 $500,000 $600,000 2018-19 Actual 2019-20 Estimated 2020-21 Estimated 2021-22 Estimated 2022-23 Estimated 2023-24 Estimated
Oak Knoll SMD Expenditure & Revenue Comparison
O&M and Regulations District CIP Transport & Treatment Revenue* (w/ proposed and estimated future rate increases) Fund Balance (Beg. FY)
PROPOSED RATES
Sewer Service Rates ($/Year Per Equivalent Residential Unit) Current Rate FY 2019-20 Proposed Rates FY 2020-21 FY 2021-22 FY 2022-23 Edgewood SMD $1,580 $1,605
(+ $25/yr or $2.08/mo)
$1,630
(+ $25/yr or $2.08/mo)
$1,655
(+ $25/yr or $2.08/mo)
Kensington Square SMD $1,350 $1,450
(+ $100/yr or $8.33/mo)
$1,550
(+ $100/yr or $8.33/mo)
$1,650
(+ $100/yr or $8.33/mo)
Oak Knoll SMD $1,395 $1,445
(+ $50/yr or $4.17/mo)
$1,495
(+ $50/yr or $4.17/mo)
$1,5455
(+ $50/yr or $4.17/mo)
Key Dates Actions
June 2, 2020 Introduce Ordinance with proposed sewer service rate and set Public Hearing for July 21, 2020. June 5, 2020 Send Proposition 218 notice (45 days prior to public hearing) to property owners with proposed rate. July 21, 2020 Hold public hearing, adopt Ordinance setting rate, and adopt FY 2020-21 Sewer Service Charges Report based on the adopted rate.
RATE SETTING TIMELINE
- Mainline (Blockage)
- Customer Sewer Laterals